
What’s new in 2020?
Since the article below was first published, Oncrawl has released its Data Studio connector, an essential tool for SEOs to leverage reporting and data visualization for not only crawl data, but also the full range of data available in the field of digital marketing. We’ve updated this article to show you how to use the connector to achieve the same—no: better—results.
What is Data Studio?
Data Studio is a free Google product that has been around since 2016. It allows you to draw from different data sources in order to produce custom reports, dashboards, and data visualizations.
In addition to plugins for certain data sources, such as Google Search Console and Google Analytics, any data accessible in a Google Sheet can also be used to provide a more complete picture of the KPIs for your business or your website.
Like other Google products in Google Drive, Google Data Studio reports can be easily shared for collaboration with contacts who have a Google login. They follow the same sharing principles and rules as other documents in Google Drive, which means, for example, that reports can also be made public for read-only viewing by anyone who has the link.
How can Data Studio leverage existing data for SEOs?
Data Studio allows SEOs to view data available elsewhere in new ways that reveal trends we couldn’t see before.
One example of a way to get a new look at data was provided earlier this year by François Goube, CEO and founder of Oncrawl. By examining differences between two periods–a functionality that is not available in Google Analytics but is easy to set up in Data Studio–, François points out that we can find extremely useful information.
He walks us through the example of pages who appear twice (or more!) as often in the SERPs in the past three months compared to the previous three months. As these pages are already ranking, and already seeing a huge increase in visibility, optimizing them can yield massive payoffs. Data Studio allows the SEO to spot this type of opportunity.
More recently, Aleyda Solis, the award winning International SEO Consultant, took a look at how to overcome the same difficulty–the inability to compare two periods–with regards to Google Search Console’s performance metrics. By providing a new Performance Report using only the information drawn from the Search Console, Aleyda is able to create a dashboard that provides actionable insights. This is a vast improvement on the Performance Report available in Google Search Console, which allows us to monitor, but not predict, compare, or identify areas for improvement in performance metrics.
Aleyda gives a few concrete examples of use cases, but there are countless others. For example, you can use Data Studio to:
- Find query-related issues that manifest through decreasing impressions and clicks but no changes in position. This can signal changes in search behavior.
- Find queries where cannibalization causes a decrease in positions, and determine which of the multiple pages for that query receives the most impressions.
What is the advantage of examining crawl data in Data Studio?
The examples above illustrate the advantage of Data Studio when using a single set of data. However, the greatest advantage of Data Studio is perhaps the ability to use multiple sources of data in the same report.
Why are additional data sources so important for crawl data? One of the difficulties with crawl data is how it can exist in isolation from user behavior and from indicators of actual website performance. This is why Oncrawl already incorporates many of these analyses when you connect third-party datasets containing information on user and bot behavior, rankings, backlinks, revenue, and so on.
Data Studio also allows you to overcome that difficulty. With Data Studio, you can do deceptively simple things, like present performance data and crawl data on the same page. And Google continues to improve the ability to combine data sources, creating blended datasets that merge data from two separate sources. This feature continues to develop, as indicated by the November 2018 product update, and now includes the ability to create calculated fields based on blended data.
Blending data in Google Studio allows you to create reports that examine the relationship between crawl data and additional behavioral indicators on your site. Below, we’ll look at just one of many use cases.
How (and why) to add conversions to your cross-analysis with crawl data
Puzzling out Google’s behavior and optimizing ranking factors to win the best positions in search results can become so consuming that it’s easy to lose sight of the main objective of search marketing: to use inbound visitors from online searches to increase profitability.
One of the best measures of profitability are Google Analytics’s Goal Completions, particularly if you’ve set up proper goals for your site. Depending on your site, every goal completion can provide you with a qualified lead, rather than just a visitor searching for a quick “how to” or a definition in one of your old blog posts. Since we’re definitely more interested in the lead than in the visitor, tracking the characteristics of landing pages that lead to goal conversions will give us key information as to what really works on the website and what doesn’t.
Step by step: Examining landing pages that convert
To blend crawl and analytics data in Data Studio, we’ll first need two data sets–one for crawl data, and one for Google Analytics–that share a unique “join key” we can use to link them. The best key to use is the URL.
1. Obtain your crawl data
For this, you’ll need the Data Studio option active for your plan. You can contact us using the blue chat button in the app if you need to get that set up.
New crawls
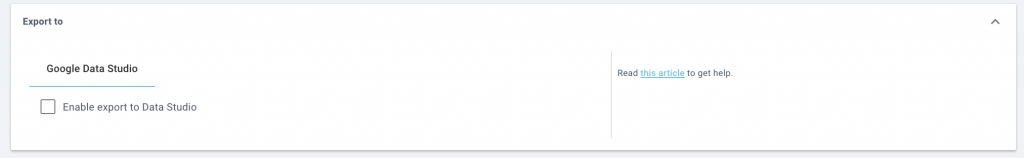
Under the crawl settings for the crawl profile you want to use in Data Studio, scroll down to the Analysis section and, under Export, activate the “Export to Data Studio” option. This will automatically make data from all new crawls with this profile available in Data Studio. The advantage of this is that you’ll be able to track the changes in your key metrics over time in Data Studio, which will update automatically whenever a new crawl is complete.
Old crawls
If you also want to include older crawls, head back to your project page. Use the three dots at the right of the crawls you’re interested in to open the menu, and select “Export to Data Studio.” (You can do this even if the crawl profile doesn’t send anything automatically.)
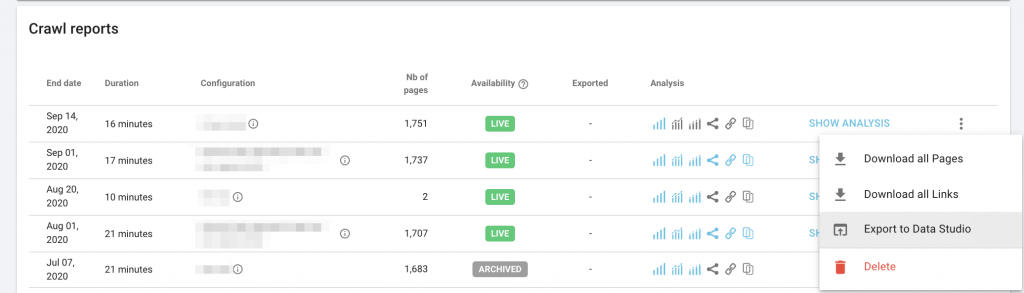
Note that you’ll need to wait for the export to finish before Data Studio will recognize that this data is available.
Data
The crawl data exported will contain all of the available characteristics you might want to track, including crawl metrics such as:
- Page load time
- Page size (weight)
- HTTP status code
- Depth
- Inrank
- Number of inlinks follow
- And many other metrics you might want to track.
Data Studio
Now you can set up the Data Studio dataset for Oncrawl. To do so, add a dataset and search for the Oncrawl connector.
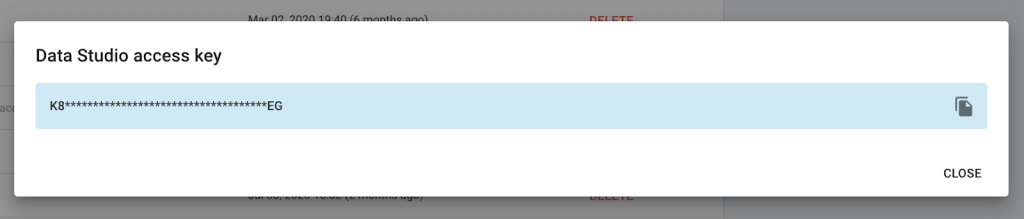
You’ll need your Data Studio key, which you can find in the crawl profile you set up to export to Data Studio, or in your Account settings, under Tokens in the left-hand sidebar.
You’ll then need to choose the crawl profile associated with this data set. If you have multiple crawl profiles, for example, in order to handle crawling separate parts of a huge site, you should set up a separate Data Studio dataset for each crawl profile you want to include. Don’t worry–in a few steps, we’ll talk about how to join, or “blend” them.
2. Obtain your analytics data
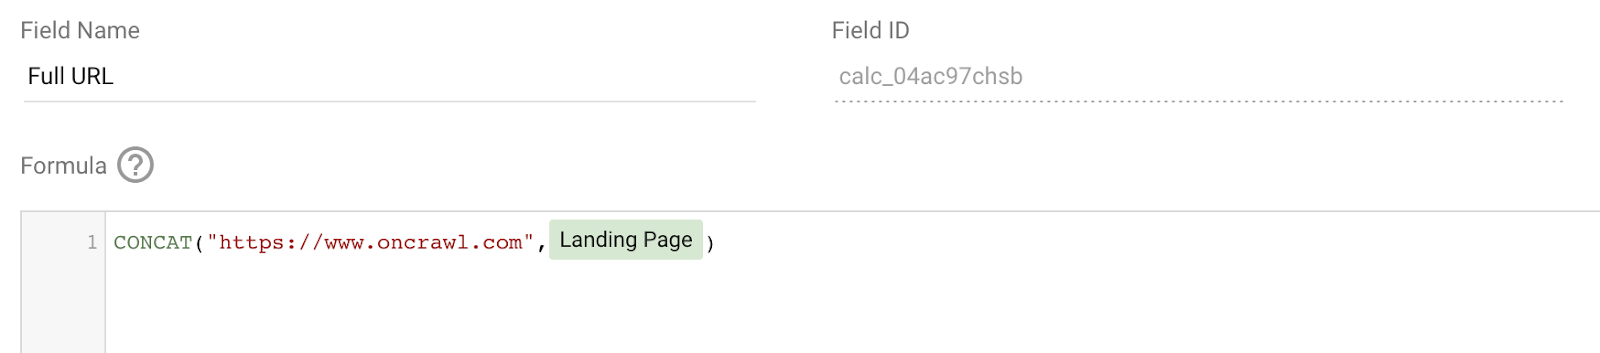
Connect your Google Analytics account as a data set in Data Studio. As Landing Pages are listed as relative paths, you will need to add a calculated field to obtain the full URL of landing pages to use as the link key at this time.
After choosing the account and properties when creating the Analytics dataset, you will find the “Fields” step. Choose “+ Add a field” at the top right. Name the field “Full URL”. Enter
CONCAT(“https://www.example.com”, Landing Page)
In the formula box. (Replace “https://www.example.com” with the address of your site.)
3. Blend crawl and analytics datasets
To blend datasets, you will need to create a chart in a report. When you create a new blank report, you’ll be prompted to add datasets. Add the Analytics and the Crawl datasets that you have just created.
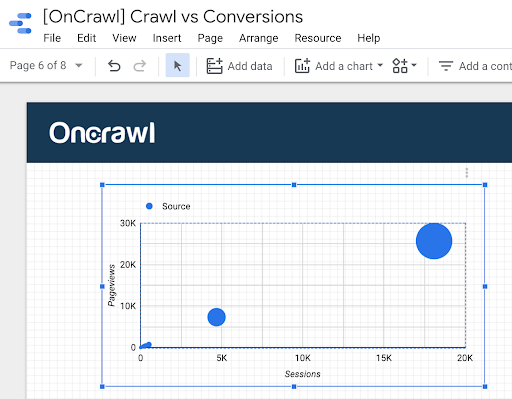
Add a chart by clicking on the type you would like to create and drawing a rectangle where you would like the chart to appear:
In the Data tab on the right, click “+ Blend data”.
Change the “Join key” dimension for Analytics to “Full URL”. You will need to use the search function to find this field. Add the metric “Goal Completions” as well as any other numerical (blue) fields you might want to use in this blended dataset.
Click “Add another data source” and choose your crawl data. The “Join key” will be listed as Missing. Replace it with the URL field. Add the numerical (blue) metrics you want to be able to compare to Goal completions using this blended dataset.
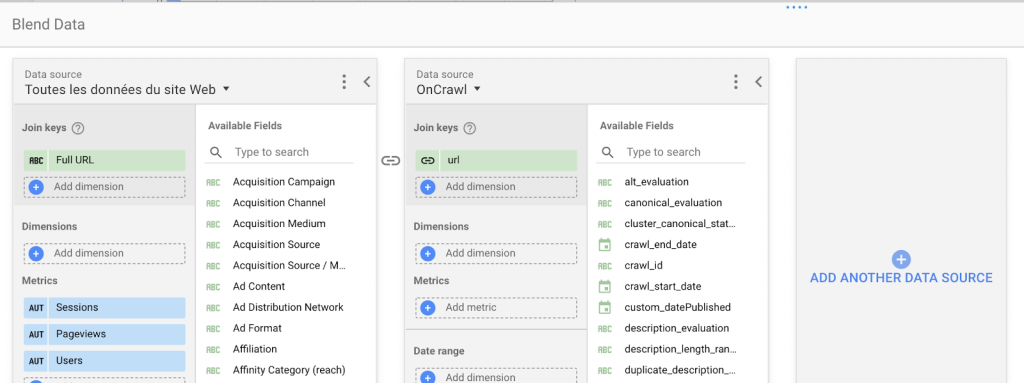
If you’re using multiple crawl profiles that you want to analyze together, add another data source for your second crawl profile. The join key is still the URL. Make sure you add the same metrics and dimensions for this crawl profile as for the first one.
When you click “Save” in the bottom right, this will most likely cause an error. That will be resolved when you reassign available fields to the different elements of the chart.
4. Prepare a chart
Assign fields to the different elements of the chart.
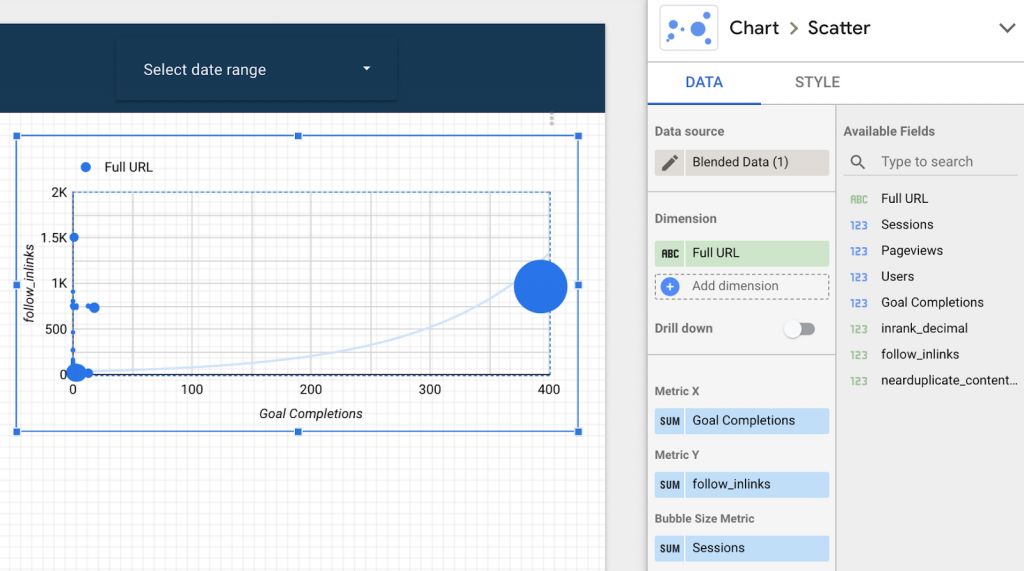
In this case, we’ve plotted goal completions versus the number of follow inlinks (links to the landing page) to view whether or not pages convert. We’ve also weighted the data by number of page views, and excluded the home page, since it performs very differently from other pages on our site.
You can then use the Style tab to modify how the chart is presented; in this case, we’ve chosen colored bubbles.
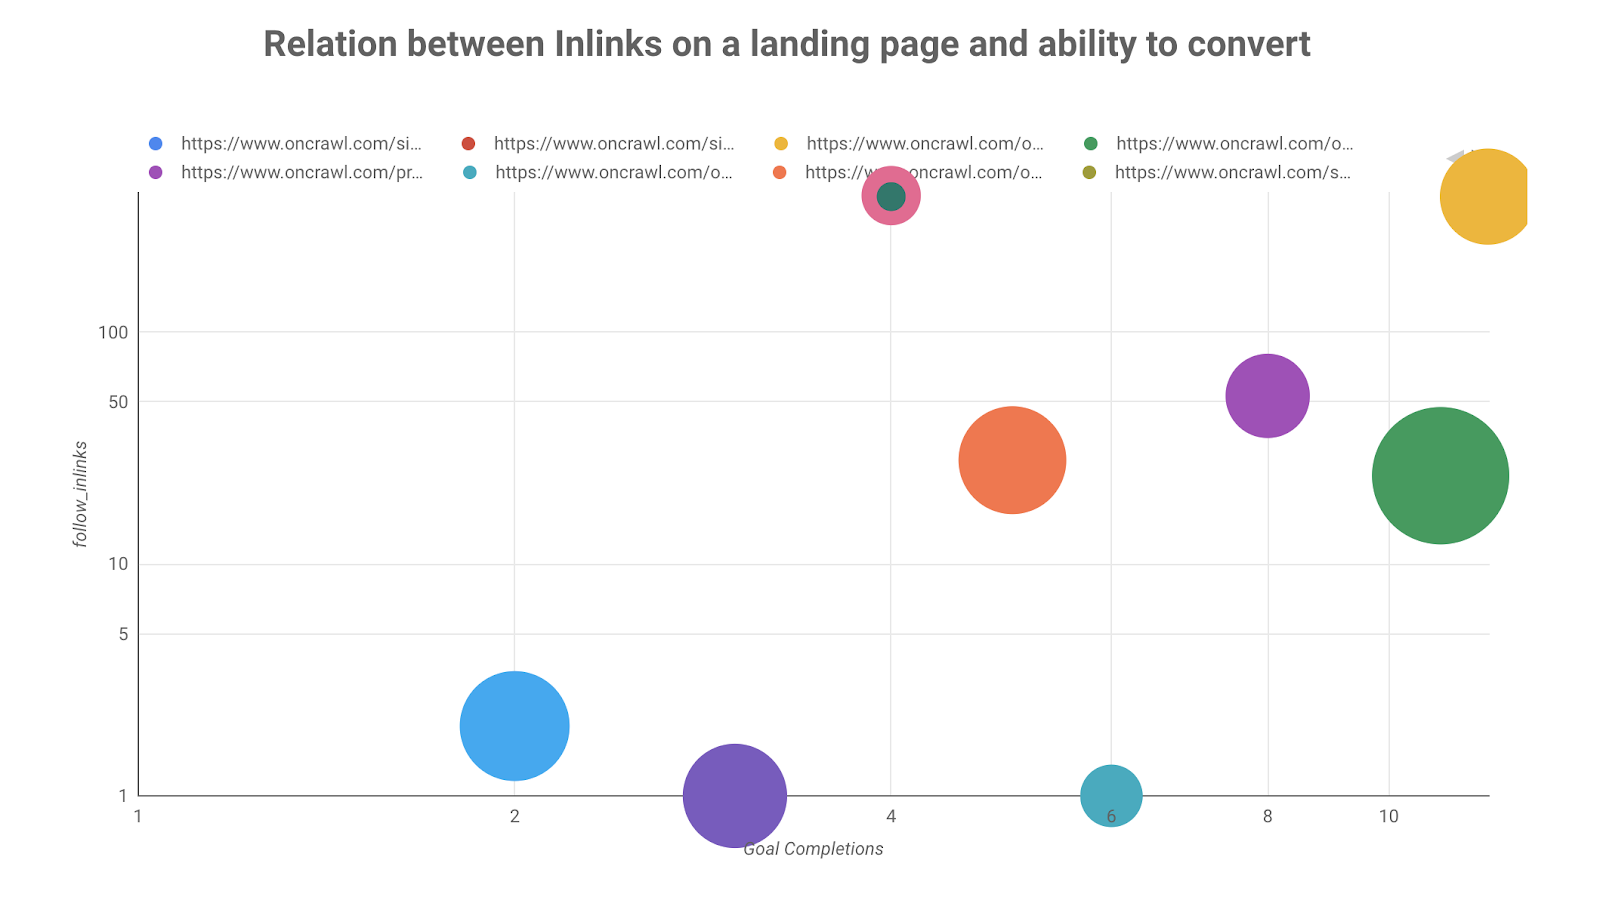
The trend between the number of inlinks on a landing page and its ability to lead to a conversion is visible in this chart. Using other charts and tables to create a full report, you can track the influence of other crawl metrics on a landing page’s ability to convert.
Just the facts: how to get Oncrawl data in Data Studio
Use the Oncrawl Data Studio connector: it makes transferring crawl data to Data Studio extremely simple–and keeps it up to date.
What to export from Oncrawl
You should export at least the most recent crawl to Data Studio. Using the automatic export option in the crawl settings allows you to make sure your Data Studio report is always up to date.
If you need back data, you can also export individual crawls from the project page… and you can even make an agency-wide dashboard by exporting crawls from different projects!
Limitations of Data Studio
Data Studio is an exciting, but in some ways still primitive tool. Keep in mind that:
- Blended datasets must all share all of the same link keys.
- Blended datasets cannot use calculated fields that have been added to original datasets.
- Metrics must be numerical values. This means that text fields added as metrics to blended datasets (including GSC queries, Oncrawl canonical status, Google Analytics countries…) will be aggregated using a count or a count-unique function.
Finally, the drag-and-drop interface means that Data Studio is more accessible than not, but if you’re one of those people like me who enjoys tweaking the code and customizing to perfection, you may find yourself frustrated.
Key takeaways
Here are the main takeaways when using Oncrawl with Data Studio:
- Use the Oncrawl Data Studio connector to easily connect to your data.
- Activate the export directly in a crawl profile in order to keep your reports automatically up-to-date.
- Blend datasets in Data Studio to perform cross-analysis on data that isn’t part of a crawl.
- If blending data, use the URL as a “join key”.
- Be mindful of the limitations of Google Data Studio and fix your ambitions accordingly.
- Data Studio can provide visualizations, comparisons, and calculations that overcome shortcomings of data display in Google Analytics and Google Search Console.
- Crawl data benefits immensely from integration with real-world performance indicators.
- Monitoring the number of conversions or conversion rates to help find your money pages and to understand which metrics have the most impact on your site’s performance