
In our field, one of the most important things you can do is successfully run efficient and pertinent cross-analysis of SEO data. With experience, you’ll that some intersections of data are more powerful than others and that as you create custom segmentations, certain patterns emerge.
« Lots of data is good but knowing what to do with them is better! » Paul Sanches, Founder of SEOHacker
In this article, we’ll attempt to share with you the best data representation models available in Oncrawl and how to use cross-data analysis to reveal optimizations that generate the most value. But this article is above all a means to help you realize that each chart in Oncrawl can (and should) be examined from different points of view.
You’ll understand how each lense through with you approach a chart can reveal an optimization or confirm/disprove a hypothesis and that it’s helpful if you’re comfortable using Oncrawl’s advanced features such as:
- Metric-based » segmentations
- Custom fields to use scraped data to create groups of pages
- Cross-segmentation in custom dashboards
All of the examples of segmentations in this article are available for download as JSON files. To apply them to your own data in Oncrawl, follow the instructions in this article to create a new segmentation. You should choose « From an existing set or import » then « Paste JSON ».
Note: it is important that you keep the exact name used for segmentations when you create them in order to take advantage of our upcoming updates.
Request your custom demo

Segmentations based on different metrics
A good segmentation is a segmentation that allows you to use the perspective of an Oncrawl field for categorizing pages based on different values in a dataset.
Let’s take five simple examples:
- Which pages rank for key expressions in featured snippet positions?
Segmentation: oncrawl-segmentation-seo-voice-search.json
Name: SEO voice search - Which pages that generate the most organic visits?
Segmentation: oncrawl-segmentation-seo-top-visits-by-day.json
Name: SEO visits by day - Which pages are the most important according to Google?
Segmentation: oncrawl-segmentation-log-bot-hits-by-day.json
Name: LOG bot hits by day - Which pages are most duplicated on my site?
Segmentation: oncrawl-segmentation-seo-duplicate-rate.json
Name: SEO duplicate rate - Which pages have the best positions on Google?
Segmentation: oncrawl-segmentation-gsc-positions.json
Name: GSC positions
If you have a visual model of a representation for these five important SEO aspects that you can use in any Oncrawl analysis, you are able to quickly detect the most important optimizations, or those that carry the most value, and prioritize your technical projects based on solid, quantified data.
Well, that’s exactly what Oncrawl segmentations allow you to do… and we’re the only ones that offer this feature!
Some examples drawn from the 5 points we mentioned above:
1. Do all the pages that rank on potential « featured snippets » receive organic visits?

2. Is the crawl frequency on my top visited paged above average?

It seems that there’s a strong correlation 😉
Even better! Are there « top visited » pages that no longer receive internal links?

3. Is there a correlation between the distance from the home page in number of clicks and Google’s crawl behavior?

4. Does duplicate content have an impact on rankings?
5. Does Google crawl pages more frequently based on their rankings (do rankings indicate that the crawl frequency is linked to rankings)?

Note: as Customer Success Managers, we see this phenomenon on nearly every website and here’s how to interpret it:
– From right to left, positions improve and the crawl frequency improves.
– Up until positions 2-3 which receive 3x more bot hits than the following positions on page 1 of the SERP.
– But in position 1 (average for the period), the crawl frequency is significantly less than for all the other groups.
When a page is in Position 1, it’s not this page that Google is going to come to check. Google will crawl its competition (imagine this chart on your competitors’ sites: it’s the same 90% of the time), and that means the competing pages in Positions 2-3.
That’s right: having new angles of view for certain data allows you to find lessons that are essential for your SEO strategy.
Now here are some neat segmentations.
Load time
Currently, load time is an important factor, both from the user’s point of view and for Google’s crawlers. The segmentation based on the « Load Time » metric allows you to classify your pages from the fastest to the slowest and to monitor the impact of load time on your users’ behavior (by crossing this data with the CTR if Google Analytics is active), on the behavior of indexing bots in logs, and on ranking performance with GSC.
Segmentation: oncrawl-segmentation-seo-load-time.json
Name: SEO load time

Impact of depth on load time
The deeper a page is in the structure, the longer it takes to respond
Note: from experience, we know that the deeper a page is, the less the elements of the system architecture have cached its data. Databases don’t have requests for it in memory, and cache systems don’t have access to its content. These pages are requested less frequently–this is normal!

Impact of load time on ranking performance
The more pages there are that respond quickly, the more pages there are that rank
Indexability
This segmentation allows you to quickly identify defects in site structure by identifying the internal links that point to the wrong version of pages or to view the Inrank (the internal popularity rate) that is sent to the wrong groups.
Segmentation: oncrawlmentation-seo-indexability.json
Name: SEO indexability-seg

Average number of inlinks by indexability type
A lot of wasted links on a group set to deny in the robots.txt, as well as on non-compliant pages

Crawl frequency by type of indexability
Many orphan pages are active and are among the biggest consumers of crawl budget
Google Search Console segmentation
Crossing crawl data with data from GSC in Oncrawl creates new fields you can use to group pages. Positions, CTR, impressions, and clicks can all become segments.
Segmentation: oncrawl-segmentation-seo-load-time.json
Name: GSC impressions

Representation of crawl frequency per number of impressions on Google
We observe that the data is coherent (crawl budget vs impressions)
Segmentation: oncrawl-segmentation-gsc-positions.json
Name: GSC positions

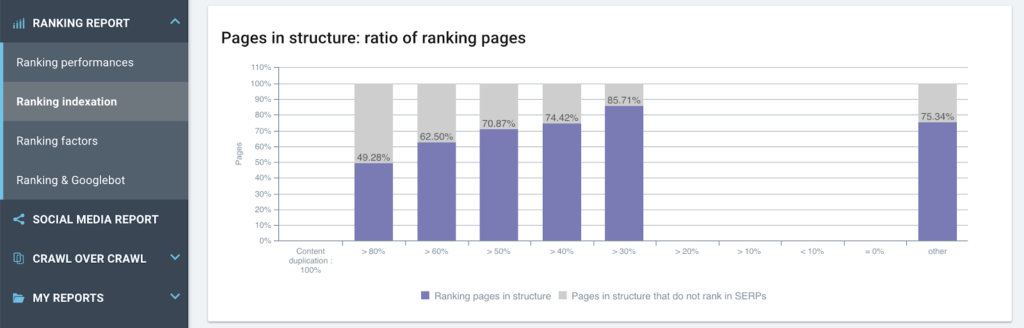
View of the ranking performance based on site structure
The deeper a page is, the less it ranks
Segmentation: oncrawl-segmentation-gsc-clicks.json
Name: GSC clicks

Impact of depth on number of clicks (and therefore on organic visits)
The higher a page is in the structure, the better its SEO performance
Segmentation: oncrawl-segmentation-gsc-ranking-pages.json
Name: GSC ranking pages

Impact of internal popularity on the ability to generate impressions (rankings)
There are obviously a few actions to be taken with regard to the internal linking of this site
Segmentation: oncrawl-segmentation-gsc-ctr.json
Name: GSC ctr

Groups of average CTR per page for positions 4-10
This allows you to quickly target the pages to optimize first (best CTRs) and to prioritize the actions to get the best results
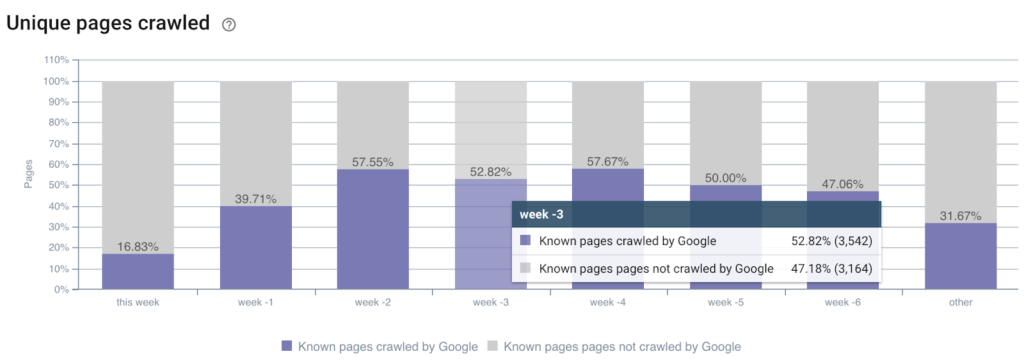
Log-based segmentation
Segmentations based on log data allow you to create obvious representations for analyzing Oncrawl charts. When we group pages based on the number of organic visits (and why not by type of bot? – mobile/desktop) or by number of bot hits per day (crawl budget), we can see the impact of each SEO element discovered by the crawler.
Segmentation: oncrawl-segmentation-log-bot-hits-by-day.json
Name: LOG bot hits by day

Representation of the frequency of Googlebot visits based on the average number of words per page
Segmentation: oncrawl-segmentation-log-seo-visits-by-day.json
Name: LOG seo visits by day

Analysis of the relationship between internal popularity and the number of visits via search engines
This suggests several optimizations: the most popular pages with no visits should be more loosely linked / certain pages have significant visits but might have less popularity; reinforcing them could be a good optimization
Traffic acquisition segmentation
Going even further, you can choose to group pages according to their current observed performance. This allows you to target sets of pages that already bring value and to quickly identify if there are optimizations (depth, Inrank, content, duplication, load time, etc.) that can benefit these pages. By optimizing page sets that already perform well, you can multiply the effect you have on traffic acquired. Your effort pays off big!
Segmentation: oncrawl-segmentation-seo-top-visits-by-day.json
Name: SEO top visits by day

Note: This sample segmentation uses log data, but can easily be adapted for use with Google Analytics sessions or GSC clicks
Segmentations based on scraped data
Oncrawl allows you to create personalized fields from rule-based extraction from the source code (XPATH or REGEX). These new fields can be used to create representative sets of pages. Types of pages, data layer, or publication dates can be used for new segmentations.
Segmentation: oncrawl-segmentation-date-published.json
Name: date published
Crawl rate of pages based on their publication date
Note: the extracted field must be named publicationDate and be a « date » type field to allow this sliding segmentation that is automatically updated with each crawl

Representation of the average number of inlinks to pages based on their publication date

Formatting of the site structure based on publication date
Segmentation based on pagetype (data drawn from the data layer)
Once your scraping rules have been set in the crawl settings (article on this subject) you will obtain new fields that correspond exactly to the type of data that your team is used to handling. When your DataLayer is set, it is used by all of the different professionals that work with you, and providing reports based on a common standard helps you work together towards a shared goal.

Study of the ratio of ranking pages that are crawled or not by Google, for each type of page as defined in the data layer
Cross-segmentation
Taken alone, these segmentations can guide you to discover optimizations or roadblocks from a macro point of view, but Oncrawl also lets you use these segmentations in a way that is unique: you can re-segment your different modes of representation to narrow down your analyses by coupling filters with charts that have been set to a fixed segmentation in Custom Dashboards.
If you’re already familiar with the Custom Dashboard feature (youtube video / article), you know that it is possible to force a chart to use a specific segmentation–a setting you can put in place by clicking on the header of the chart when creating a custom dashboard. This allows you to maintain a global segmentation (the segmentation set by the menu at the top of the page) and to view the data in the chart with a representation drawn from a different segmentation.
For example:
I’d like to know the exact distribution of Inrank within a group of pages in the « Top Destination » segmentation, and I want to display that data for a specific country using the « GSC Impressions » view in the chart.

Illustration of cross-segmentation: using two segmentations on the same chart
Conclusions
Once we take a step back from the overly restrictive segmentation based on URL paths, we’re able to explore site data from very different and much more precise angles. Oncrawl is currently the only tool that allows you to format all of the available data in this way.
With a little experience and curiosity, you’ll be able to make your data speak more efficiently and you won’t be able to avoid finding new routes for pertinent SEO improvements that will be easy to prioritize.
The only limit in the creation and exploration of Oncrawl’s segmentation is the limit of your own creativity. The ball’s in your court now!
And don’t forget: all of the Oncrawl team is here to help you with your project.