Home > Connectors > Looker Studio (ex Data Studio) + Oncrawl

Data Studio + Oncrawl

Enrich your crawl data with business intelligence and data visualization to create blended analyses to improve KPI tracking and reporting.

oncrawl data studio

Access your Oncrawl data in Google Looker Studio

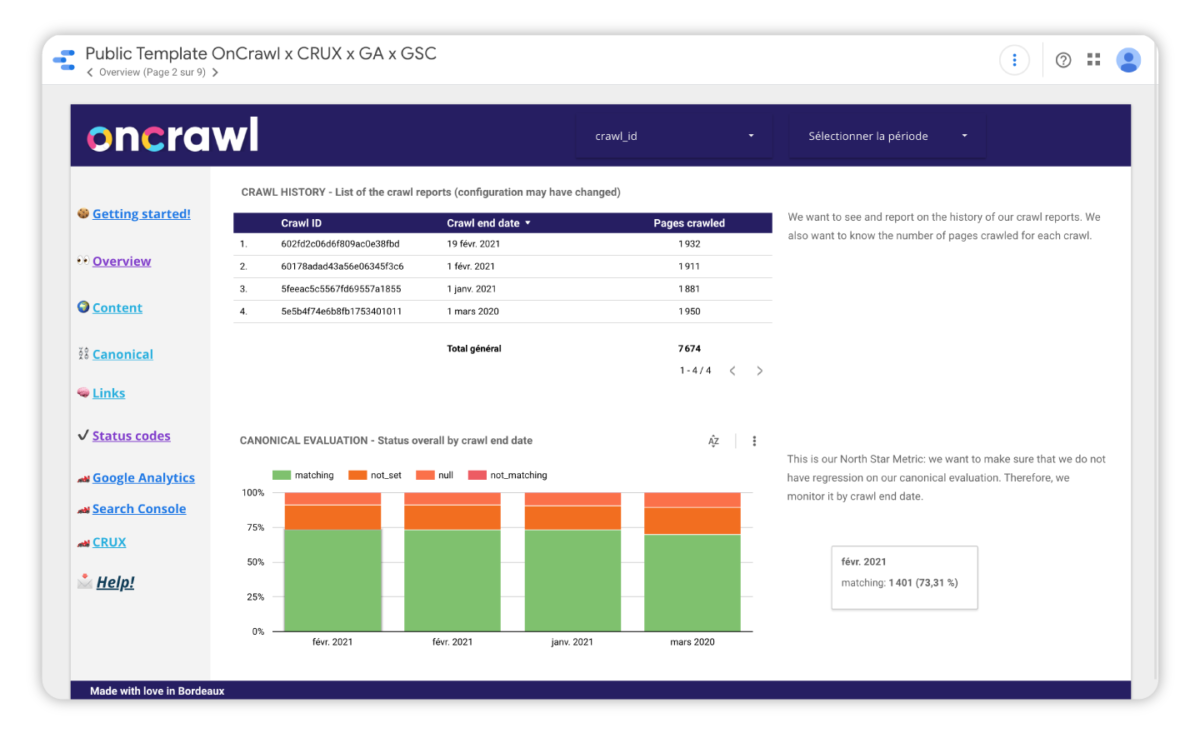
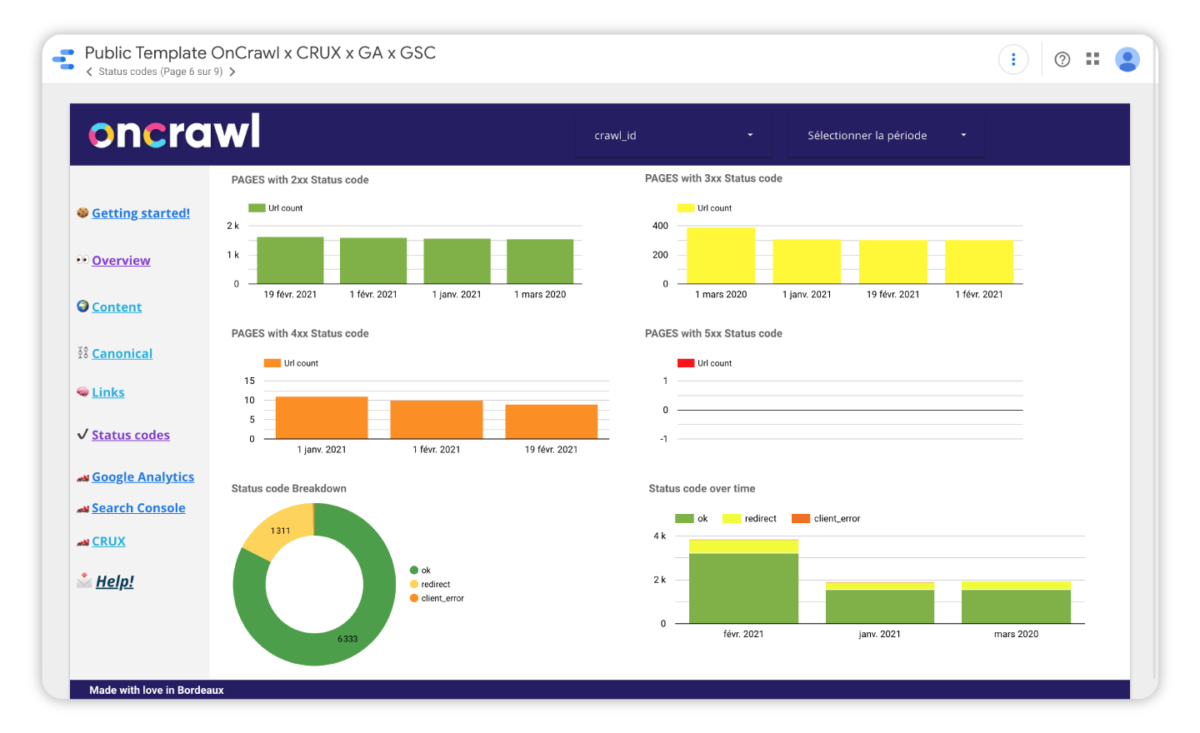
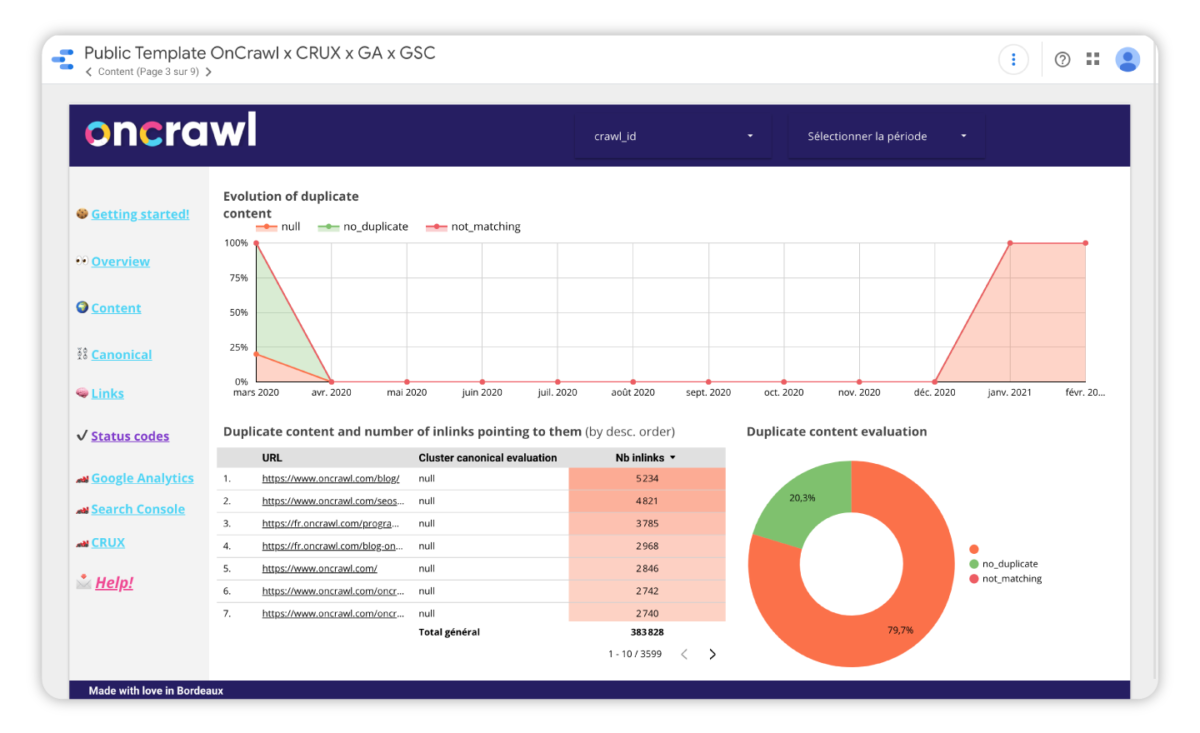
Visualize your site’s evolution in Google Data Studio

Use Looker Studio to monitor your site’s growth, track your SEO progress, or discover areas for improvement that can become SEO quick wins. With regular crawls and analyses in Oncrawl, Data Studio gives you an easy way to plot progressive changes over time.

Create rich, custom reports using any Oncrawl metric

Reports and dashboards with exactly the information you need have never been easier to obtain. With over a hundred different Oncrawl metrics at your fingertips, the Oncrawl Data Studio connector brings all of Oncrawl to Looker Studio to help your crawl data tell a visual story.

Template-oncrawl-Data-Studio

Cross-analyze your Oncrawl data with any other data in Google Data Studio

Blend Oncrawl data with any other data source available in Looker Studio to take your analyses even further. Dive into business metrics, ROI, or display SEO data side-by-side with charts and tables from other marketing operations.

Template-Data-Studio-oncrawl

Connect Google Looker Studio and Oncrawl

Get your Oncrawl data in Looker Studio

Find out more about Oncrawl's product solution

Requirements

  • Access to Google Looker Studio
  • Active Oncrawl subscription with Oncrawl for Looker Studio

For questions about our connectors, please contact support@oncrawl.com
For help using Oncrawl’s Looker Studio connector, please consult the documentation

Help with Oncrawl + Data Studio

About Google Looker Studio

Looker Studio (ex-Data Studio) is a data visualization product by Google that allows you to “tell your story in data”. Using Google-approved connectors, you can draw from data in sources such as Google Analytics or Google Search Console, Google Sheets, Google Ads; from databases including Big Query, MySQL, and PostgreSQL; from social media platforms; and from CSV and Google Cloud Storage files.
Data Studio’s drag-and-drop interface with configurable charts and tables combine with collaboration and sharing features to create rich, visual reports that make data speak.