This is week 4 of the 30-day SEO transformation series. Each week focuses on a specific Oncrawl Lens and provides a practical playbook for improving your site’s search visibility.
Week 4: Master speed and user experience with the Performance Lens
You’ve made it to the final week of the 30-day transformation. Over the past three weeks, we have worked on building a solid foundation: structural issues have been identified and are being resolved, content quality is improving, and your monitoring system is now protecting those gains.
But there’s one more piece to the puzzle. Even if search engines can find your pages and your content is well-optimized, slow load times and poor user experience signals can still hold you back from ranking where you deserve or showing up in AI search results.
This week focuses on performance, a key part of any good SEO strategy.
What’s really at stake
The improvements you’ve made in weeks 1 through 3 can be undermined by poor page performance. Here’s what’s on the line:
- Lost conversions: Studies consistently show that each additional second of load time increases bounce rates significantly.
- Crawl budget waste: Slow pages consume more of your crawl budget, potentially limiting how many of your pages search engines can process.
- Poor AI search visibility: As AI search continues to evolve, user experience signals are becoming increasingly important in determining which sources get cited.
The challenge
Let’s take a look at our multi-brand e-commerce platform scenario (47,000 URLs, 185,000 monthly visits) one final time.
Where we left off after week 3
You’re seeing improvements in your overall SEO due to the fixes you have started implementing:
- Orphan pages are being reintegrated
- Indexability issues are being addressed
- Content quality scores are improving
- Your monitoring system is now actively watching your most important pages for regressions
But as you review your dashboards, you notice something concerning: many of your high-value pages are loading slowly. Your Sanity Check alerts have been flagging pages that take more than two seconds to load and the pattern is widespread.
This week’s challenge
You need to understand the full scope of your performance issues and prioritize fixes that will have the greatest impact. Specifically, you need answers to these questions:
- Which pages are failing Core Web Vitals thresholds?
- Are performance issues concentrated in specific page types or spread across the site?
- What’s causing the slowdowns and which fixes should be prioritized?
- How do performance issues correlate with business-critical pages?
To effectively address these questions, you need to measure speed at scale and to connect your findings to the pages that drive business.
The solution
The Performance Lens measures load times and user experience signals that influence whether your pages are considered reliable sources. The dashboard provides clear, prioritized insights into performance issues affecting UX including average performance score, average load time and average page weight.
Why this matters now
Performance optimization is the natural conclusion to your 30-day transformation: it is where technical SEO meets user experience.
We’ve spent the past three weeks working on the technical aspects of your site, but all of that effort means little if visitors have a poor experience once they arrive.
Remember, users have options. If your pages are slow or frustrating, they’ll leave for a competitor who offers a better experience.
We’ve worked on getting users to your site, now we’ll do the work that keeps them there.
The goal by Friday
By the end of week 4, you’ll have a complete picture of your site’s performance health and a prioritized plan for optimization. You’ll know which pages need immediate attention, what’s causing the issues, and how to track improvement over time.
More importantly, you’ll have completed the full 30-day transformation cycle: discovery, optimization, protection, and performance. Your site will be structurally sound, content-optimized, actively monitored, and fast.
The 5-day playbook
Let’s explore how you can use the Performance Lens to complete your SEO transformation.
Day 1: Setup and baseline measurement
Step 1: Create your predefined list of URLs to explore
In previous weeks, the crawl configurations used spider mode, starting from a key URL and following links to map your full site structure. This week is different: the Performance Lens uses a seed file.
A seed file is a text file or spreadsheet containing a curated list of URLs. Instead of discovering pages through links, the crawl measures only the specific pages you include.
This targeted approach lets you focus performance analysis on your most important pages without measuring your entire site.
Start by compiling a list of your highest-priority pages. You should pull from the tiered monitoring system established in week 3:
- Tier 1 pages (top 100 revenue-generating pages)
- Category and brand pages that drive significant traffic
- Landing pages for key campaigns or product launches
- Pages flagged for slow loading in your Sanity Check monitoring
For our e-commerce scenario, this might include the top 100 product pages, all 850 category pages, and the 20 brand pages – roughly 1,000 URLs total.
Step 2: Configure your Performance Lens crawl
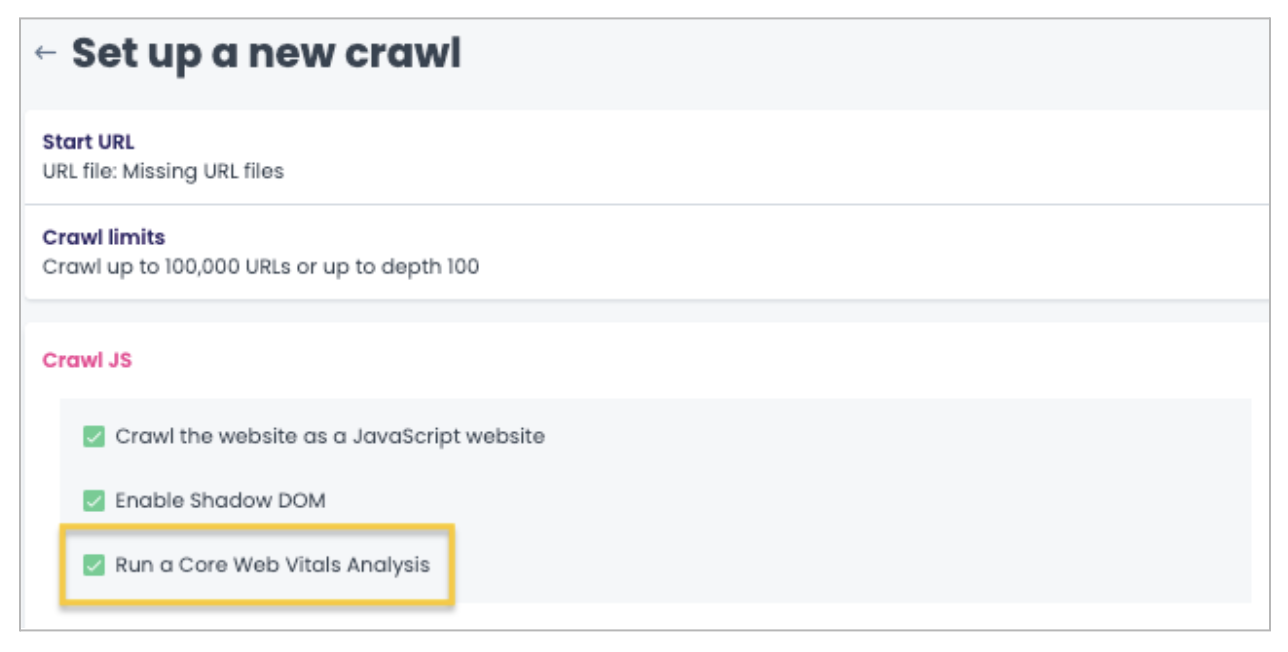
Navigate to your project dashboard and select the Performance Lens. Upload your seed file.

You can modify your crawl settings, but the Lens is already pre-configured to collect Core Web Vitals metrics.

Set your crawl to run daily. Since you’re working with a defined list of URLs rather than crawling your entire site, daily performance checks are both feasible and valuable.
This frequency allows you to catch performance regressions quickly and measure the impact of optimizations.
Step 3: Document your baseline metrics
Document baseline metrics for each page segment:
- Percentage of pages passing each Core Web Vitals threshold
- Average LCP, TBT, and CLS scores by segment
- Distribution of performance scores across priority pages
This helps you track improvement.
Days 2-3: Analysis and pattern identification
Step 4: Review your Performance dashboard
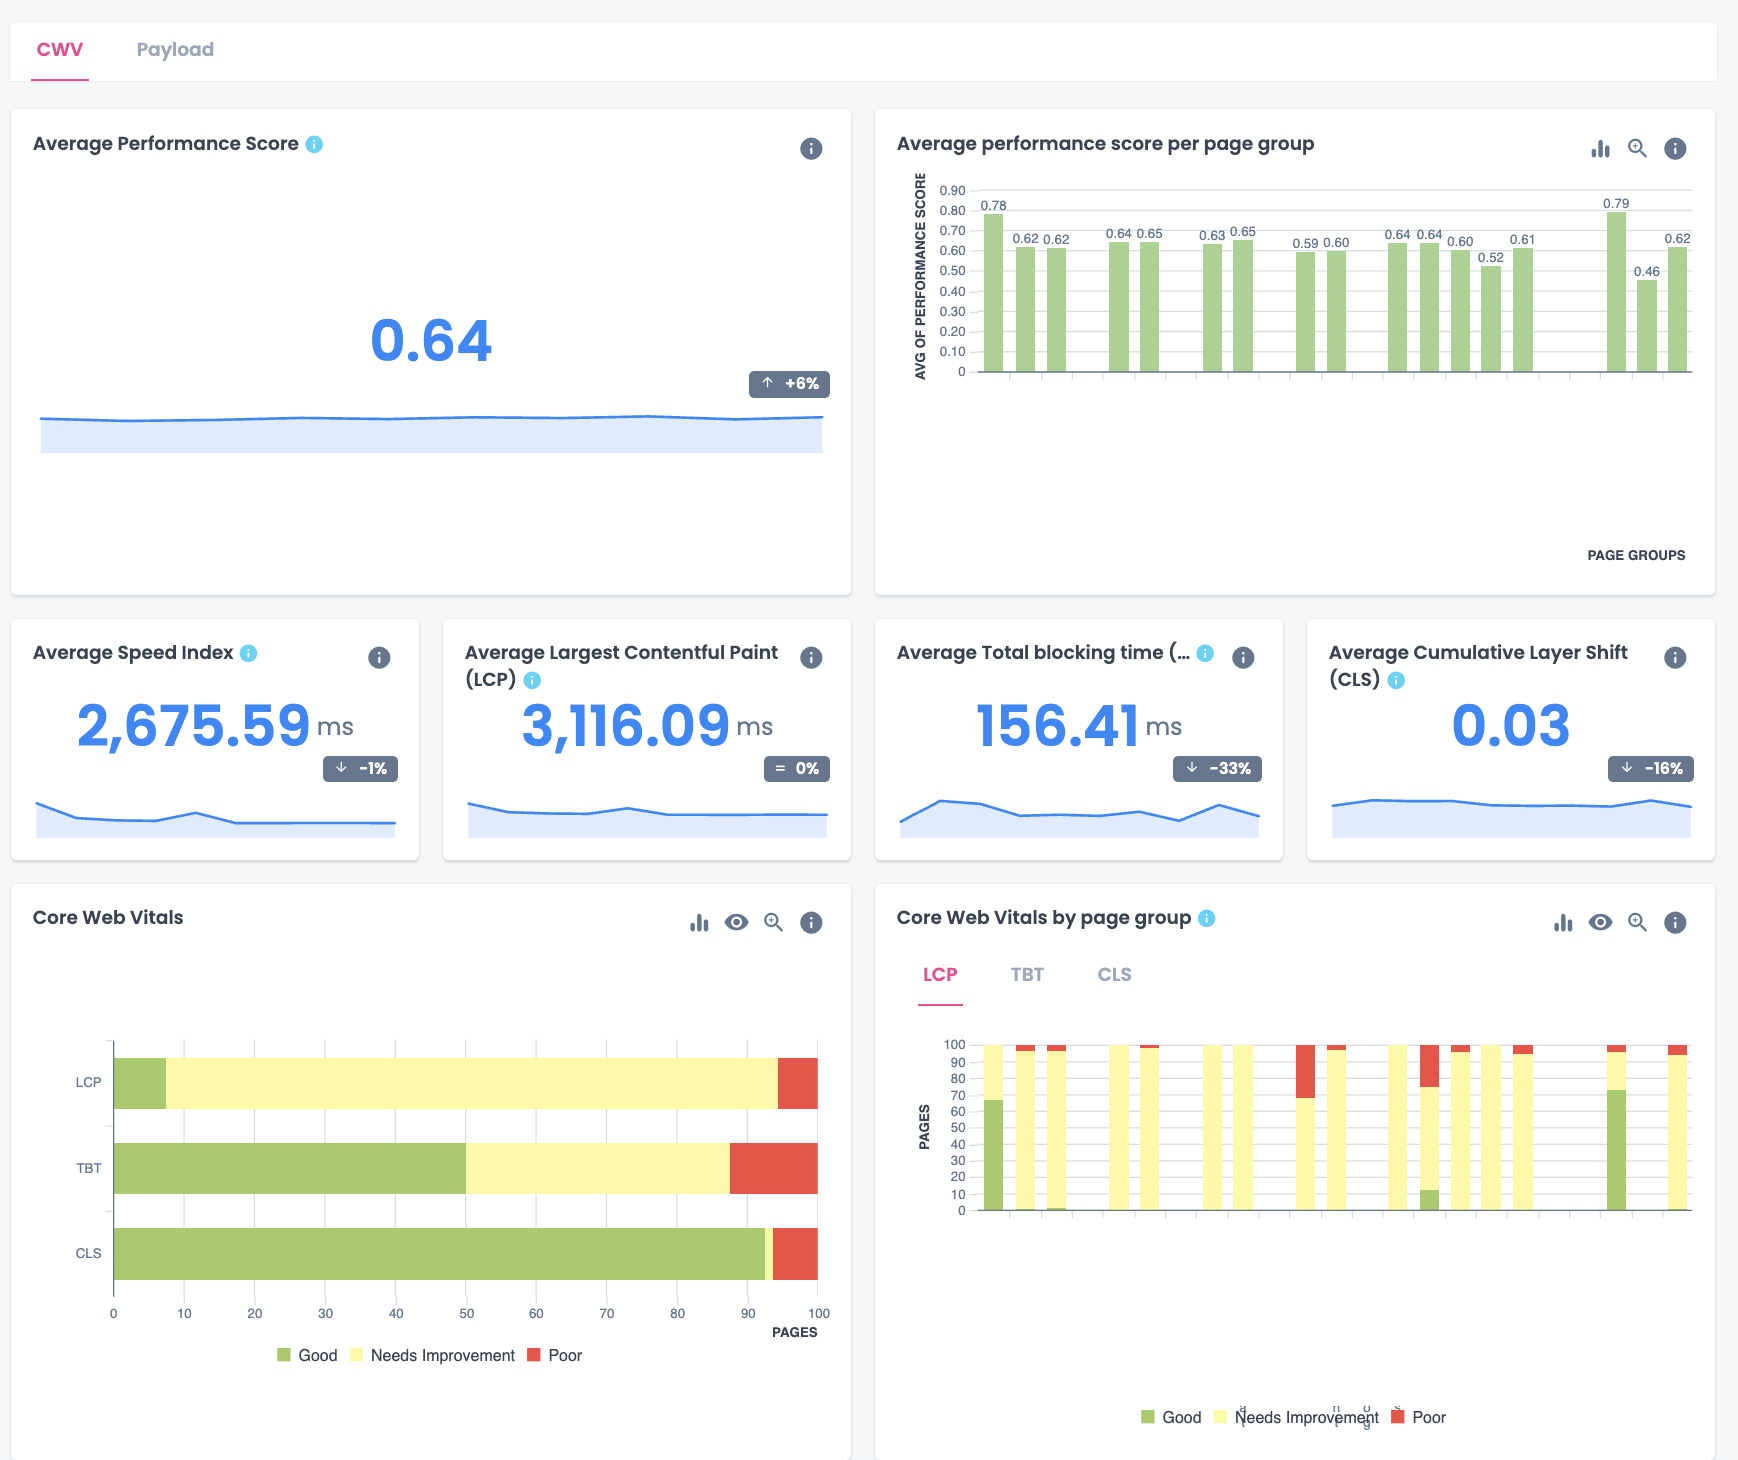
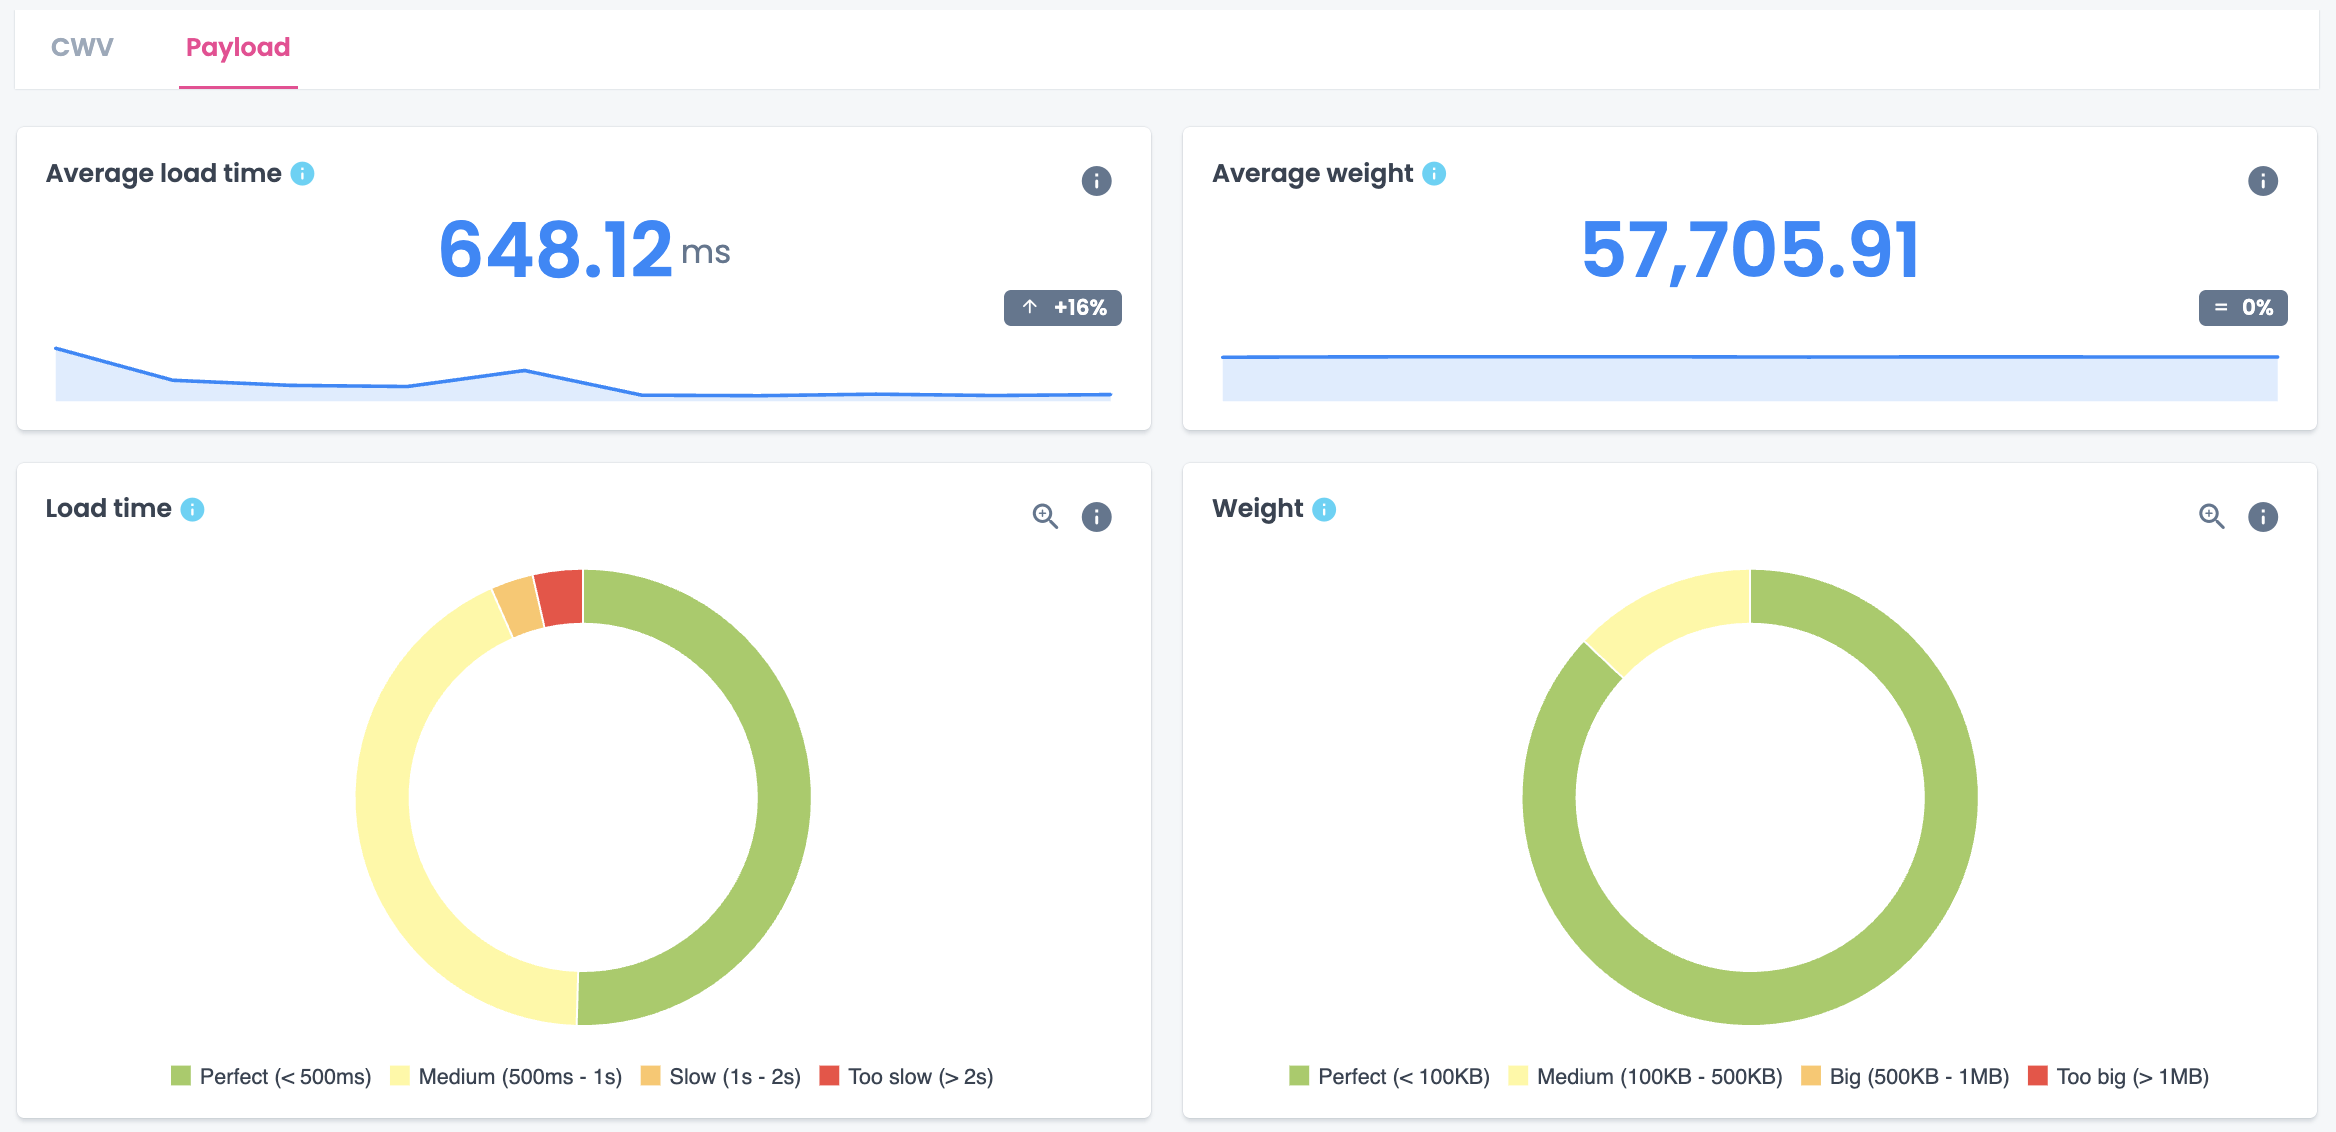
Once your crawl is complete, access your Performance dashboard. It’s organized into two main sections: CWV (Core Web Vitals) and Payload.
CWV section
Here, you will find the Average Performance Score. It is a Lighthouse-based benchmark, on a 0-1 scale, where higher scores indicate better performance.
You can also find individual metrics: Speed Index (how quickly visible content appears), LCP (how fast largest visible elements load), Total Blocking Time (how long the page is unresponsive), and CLS (layout stability during loading). Each metric includes guidance on what causes poor scores and how to fix them.
The Core Web Vitals summary shows how your pages are distributed across Good, Needs Improvement, and Poor, giving you a quick sense of how many pages meet Google’s thresholds.

Payload section
This section provides the average load time and page weight along with distributions showing how pages fall into performance categories (Perfect, Medium, Slow, Too Slow) and size categories (Perfect, Medium, Big, Too Big).

Step 5: Identify patterns by segment
The real power of the Performance dashboard is analyzing metrics by page group.
Breaking down data by segment reveals systematic issues that site-wide averages can hide.
Start by looking at the Average Performance Score by page group. Significant variation – some segments scoring in the 0.70s while others fall below 0.50 – often points to template-level differences or inherently heavier content types.
Next, examine Core Web Vitals by segment. A segment where most pages need improvement on LCP but score well on CLS tells a different story than one struggling across all three metrics. Look for these patterns to understand whether issues stem from specific performance problems or broader technical debt.
Finally, check Payload metrics by segment. Pages categorized as Slow or Too slow (over 1 second) need immediate attention, especially in high-priority segments. Segments with high proportions of Medium or Big page weights may benefit from image optimization or code cleanup.
For our e-commerce scenario, this analysis might reveal:
| Segment | Avg performance score | Primary CWV issue | Load time concern |
|---|---|---|---|
| Product pages | 0.63 | LCP (87% need improvement) | 40% in Medium range |
| Category pages | 0.52 | TBT (65% poor) | 18% Slow or Too slow |
| Brand pages | 0.65 | CLS (15% poor) | Mostly Perfect |
| Blog content | 0.58 | LCP (90% need improvement) | 25% Slow or Too slow |
Category pages stand out as the most problematic segment. They have the lowest performance score (0.52), 65% fail TBT thresholds, and nearly one in five load too slowly.
This pattern suggests heavy JavaScript that’s both slowing initial rendering and blocking user interactions. Because it affects an entire page type, it’s likely a template-level issue.
Step 6: Cross-reference with business data
Performance data alone doesn’t tell you where to start. Connect your Performance dashboard findings with business metrics from Google Search Console and Google Analytics to prioritize fixes based on actual impact.
Why this matters: A category page template with poor TBT scores is just a technical problem until you know those pages drive 40% of your revenue. Suddenly, it’s your top priority. Performance issues hurt most where traffic and business value are highest.
Identify which underperforming segments drive the most revenue or traffic so you know which technical problems are costing you money.
Then, look for specific opportunities where performance improvements can drive results:
- High impressions + poor performance scores: Speed improvements could directly increase click-through rates from search results.
- High bounce rates + slow load times or poor TBT: Users are leaving before pages become usable. Fixing this recovers lost conversions.
- Rankings in positions 4-10 + poor Core Web Vitals: Better performance might provide the competitive edge to move up in search results.
Use the page group breakdown to prioritize your approach. If product pages have acceptable load times but poor LCP scores, focus on image optimization. If category pages show both high TBT and slow load times, the culprit is likely JavaScript that needs to be deferred or removed.
For a more in-depth analysis, scrape for the number of images and/or videos on each page and create a segmentation by range to see if there’s any correlation between media volume and poor scores.
Day 4: Prioritization and action planning
Step 7: Prioritize based on impact and create your roadmap
Use the same prioritization framework from earlier weeks, now informed by your Performance dashboard metrics:
P0 (Critical): Segments with poor performance scores (below 0.50) that are business-critical, or where a significant percentage of pages load Too slow. Template-level issues affecting high-traffic page types belong here.
P1 (High): Segments scoring 0.50-0.65 with clear, fixable issues. Pages in Needs Improvement rather than Poor often represent quick wins, like LCP issues from unoptimized images.
P2 (Medium): Segments with acceptable overall performance but isolated issues, or problems requiring coordination with other teams (like CLS from ad placements).
For our e-commerce scenario, here’s how to prioritize and plan your fixes:
| Priority | Issue | Rationale | Action | Owner | Timeline |
|---|---|---|---|---|---|
| P0 | Category page TBT and load time | Lowest performance score (0.52), 65% poor TBT, affects all 850 category pages | Audit and defer non-critical JS; implement code splitting; optimize third-party scripts | Dev team | Weeks 5-6* |
| P1 | Product page LCP optimization | 87% need improvement on LCP, likely image-related, fixable at template level | Implement lazy loading; convert images to WebP format; set explicit dimensions | Dev team | Week 5 |
| P1 | Blog content LCP and load time | 25% load slowly, high-traffic entry points from organic search | Reduce page weight; compress images; defer non-critical resources | Dev team + Content | Week 5-6 |
| P2 | Brand page CLS issues | Within 48-72 hours | Reserve space for ad slots; coordinate with ad partners on dimensions | SEO + Ads team | Ongoing |
Note: Performance optimization often requires development work that extends beyond this 30-day period. The goal of week 4 is to identify and prioritize issues, giving your team a clear, data-backed roadmap for ongoing improvements. Some fixes will likely take place after the 30 days (weeks 5-6) depending on development bandwidth.
Step 8: Integrate with ongoing monitoring
Add these performance metrics to the Sanity Check monitoring system you established in week 3, setting alert thresholds based on the priority levels above.
Day 5: Wrap up and next steps
Step 9: Document your 30-day transformation
You’ve built a comprehensive SEO foundation in just 30 days. Now you should document what you’ve accomplished:
Week 1 – Structural improvements: Document the baseline availability and indexability metrics, the issues identified, and the fixes implemented or in progress.
Week 2 – Content optimization: Summarize the content quality scores before and after, the systematic issues identified, and the optimization roadmap.
Week 3 – Monitoring infrastructure: Describe the monitoring system established, the pages under surveillance, and the alert thresholds configured.
Week 4 – Performance baseline: Present the Core Web Vitals analysis, the prioritized optimization plan, and the expected impact.
Include a timeline for ongoing work and establish a cadence for progress reviews.
What success looks like
By the end of week 4, you should have four concrete deliverables:
✔️ Complete Core Web Vitals analysis for your priority pages
✔️ Performance issues identified and categorized by segment
✔️ Prioritized optimization roadmap with owners and timelines
✔️ Complete 30-day transformation summary for stakeholders
Pro tips
Tip 1: Use the monitoring feedback loop
The daily crawl frequency of the Performance Lens means you can quickly validate whether fixes are working. After implementing an optimization, watch the next few crawl reports to confirm the improvement. If metrics don’t improve as expected, investigate before moving on to the next fix.
Tip 2: Translate performance into business outcomes
When presenting performance findings to stakeholders, translate technical metrics into business impact. The Performance Score is particularly useful here because it provides a single number on a 0-1 scale that is easy to track over time.
Tip 3: Optimize performance at the template level first
Template-level performance fixes (reducing JS, optimizing image handling) deliver the highest return across large page sets.
Common mistakes to avoid
Trying to fix everything at once
As in week 1, avoid trying to fix everything simultaneously. Performance work is no exception. It can be overwhelming because there are always more improvements to make, but stick to your prioritization framework. Focus on the changes that will have the greatest impact on your business-critical pages first.
Ignoring mobile performance
Google uses mobile-first indexing, which means your mobile performance matters more than desktop for rankings. Make sure your Performance Lens analysis includes mobile data, and prioritize fixes that improve mobile experience.
Your transformation is complete, but the work continues
Congratulations on completing the 30-day SEO transformation! You’ve built a comprehensive understanding of your site’s health across structure, content, monitoring, and performance.
But SEO is never truly “done.” The systems you’ve built are designed for ongoing maintenance and continuous improvement. Your monitoring catches new issues as they arise, your segmentation helps you identify patterns quickly, and your prioritization framework guides future optimization efforts.
The difference now is that you’re no longer optimizing in the dark. You have the visibility, tools, and processes to make informed decisions about where to invest your SEO resources.
Looking ahead
With your transformation complete, you have a sustainable SEO operating model. The four Oncrawl Lenses work together to give you continuous visibility:
- Crawl Discovery for periodic structural audits
- Content Lens for ongoing content quality assessment
- Sanity Check for daily monitoring and protection
- Performance Lens for speed and user experience tracking
Use them individually as needed or run comprehensive audits using all four when preparing for major site changes or strategic reviews.
Want to keep the momentum going? Download this complete guide as a PDF for easy reference, and consider scheduling quarterly reviews using all four Lenses to ensure your site continues to improve.

