
Log analysis is the most thorough way to analyze how search engines read our sites. Every day SEOs, digital marketers and web analytics specialists use tools that show diagrams about traffic, user behaviors and conversions. SEOs usually try to understand how Google crawls their site via Google Search Console.
So… why should an SEO analyze other tools to check if a search engine is correctly reading the site? Ok, let’s start with the basics.
What are log files?
A log file is a file where the server web writes a row for every single resource on the website that is requested by bots or users. Each row contains data about the request, which may include:
caller IP, date, resource required (page, .css, .js, …), user-agent, response time, …
A row will look something like this:
66.249.**.** - - [13/Apr/2021:00:07:31 +0200] "GET /***/x_*** HTTP/1.1" 200 40960 "-" "Mozilla/5.0 (compatible; Googlebot/2.1; +http://www.google.com/bot.html)" "www.***.it" "-"
Crawlability and Updateability
Every page has three basic SEO statuses:
- crawlable
- indexable
- rankable
From the log analysis perspective, we know that a page, in order to be indexed, must be read by a bot. And likewise, content already indexed by a search engine must be re-crawled to be updated in the search engine’s indexes.
Unfortunately, in Google Search Console, we don’t have this level of detail: we can check how many times Googlebot has read a page on the site in the last three months and how fast the web server responded.
How can we check if a bot has read a page? Of course, by using log files and a log file analyzer.
Why do SEOs need to analyze log files?
Log file analysis allows SEOs (and System Administrators, too) to understand:
- Exactly what a bot reads
- How often the bot reads it
- How much crawls cost, in terms of time-spent (ms)
A log analysis tool enables logs to be analyzed by grouping information by “path”, by file type, or by response time. A great log analysis tool also allows us to join information obtained from log files with other data sources like Google Search Console (clicks, impressions, average positions) or Google Analytics.
Oncrawl Log Analyzer

What to look for in log files?
One of the main important pieces of information in log files is what isn’t in log files. Really, I’m not joking. The first step in understanding why a page isn’t indexed or isn’t updated to its latest version is to check if the bot (for example Googlebot) has read it.
Following this, if the page is frequently updated, it may be important to check how often a bot reads the page or the site section.
The next step is to check which pages are read most frequently by bots. By tracking them, you can check if these pages:
- deserve to be read so often
- or are read so often because something on the page causes constant, out-of-control changes
For example, some months ago, a site I was working on had a very high frequency of bot readings on a strange URL. The bot revealed this page was from an URL created by a JS script, and that this page was stamped with some debugging values that changed each time the page was loaded… Following this revelation, a good SEO can surely find the right solution to fix this crawl budget hole.
Crawl budget
Crawl budget? What is it? Every site has its metaphorical budget related to search engines and their bot. Yes: Google sets a sort of budget for your site. This isn’t recorded anywhere, but you can “calculate” it in two ways:
- checking the Google Search Console Crawl stats report

- checking the log files, grepping (filtering) them by the user-agent containing “Googlebot” (You’ll get best results if you make sure that these user-agents match with the correct Google IPs…)
The crawl budget increases when the site is updated with interesting content, or when it regularly updates content, or when the site receives good backlinks.
How the crawl budget is spent on your site can be managed by:
- internal links (follow / nofollow too!)
- noindex / canonical
- robots.txt (careful: this “blocks” the user-agent)
Zombie pages
For me “zombie pages” are all the pages that have had not had any organic traffic or bot visits for a considerable period of time, but have internal links pointing to them.
This type of page can use too much crawl budget and can receive unnecessarily page rank due to internal links. This situation can be solved:
- If these pages are useful for the users who come to the site, we can set them to noindex and set the internal links to them as nofollow (or use disallow robots.txt, but be careful with this…)
- If these pages are not useful for the users who to come to the site, we can remove them (and return a status code of 410 or 404) and remove all the internal links.
With Oncrawl we can create a “zombie report” based on:
- GSC impressions
- GSC clicks
- GA sessions
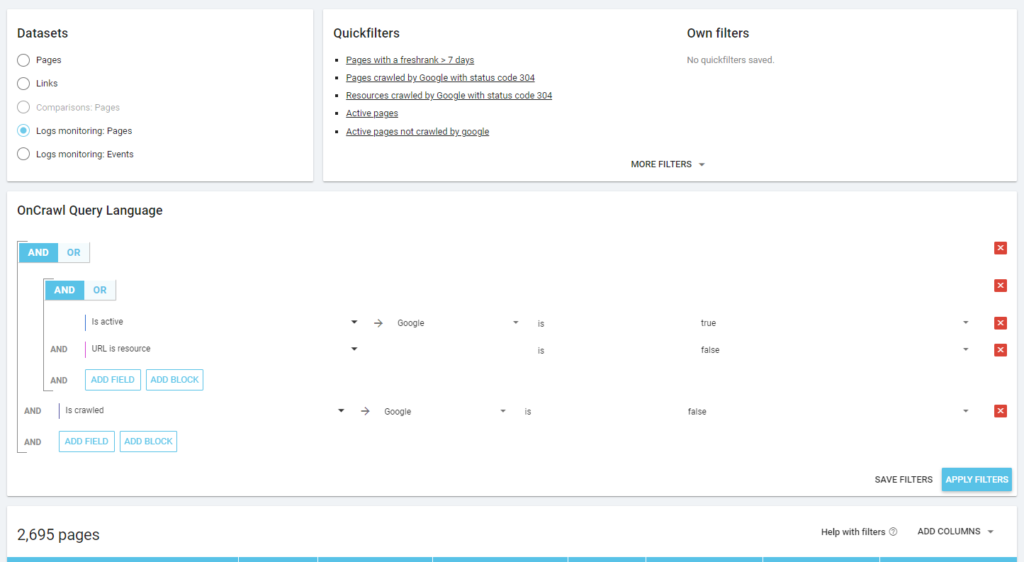
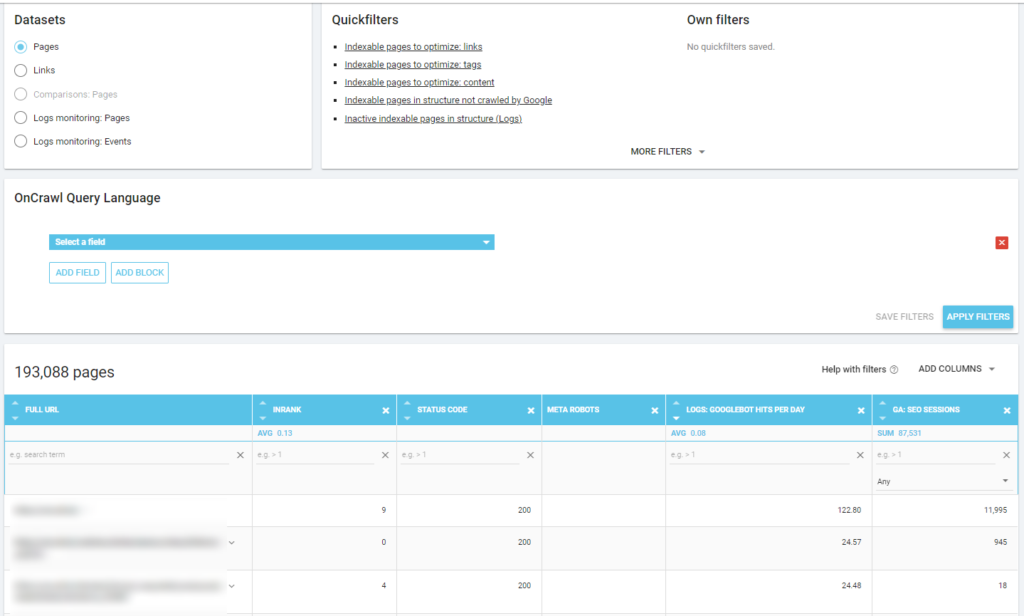
We can also use log events to uncover zombie pages: we can define a 0 event filter, for example. One of the easiest ways to do this is to create a Segmentation. In the example below, I filter all pages with the following criteria: no Googlebot hits but with an Inrank (this means that these pages have internal links that point to them).
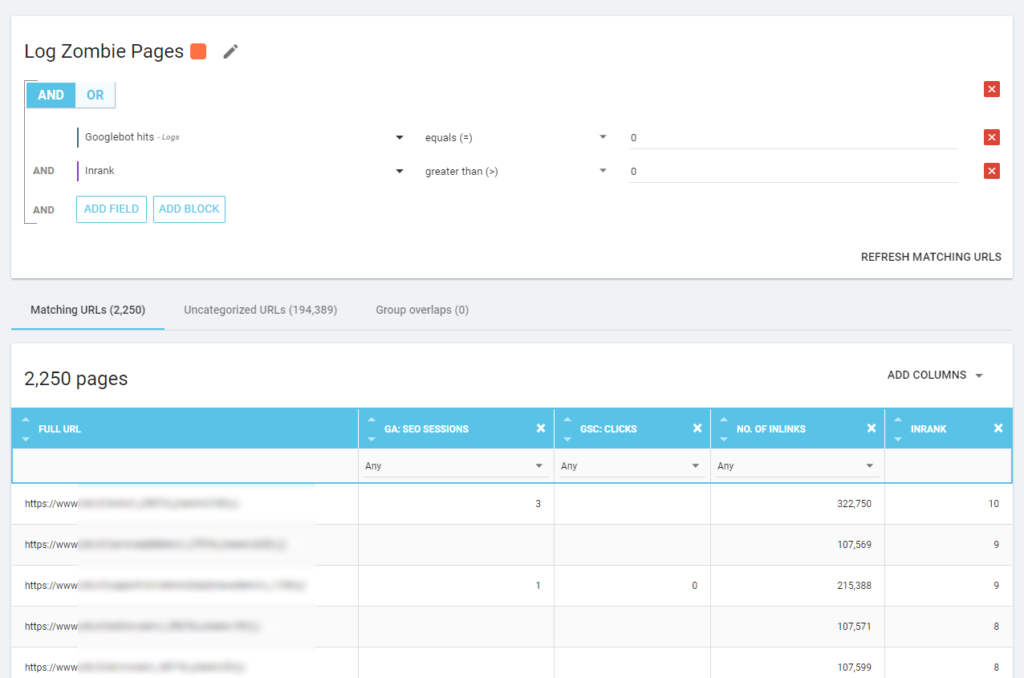
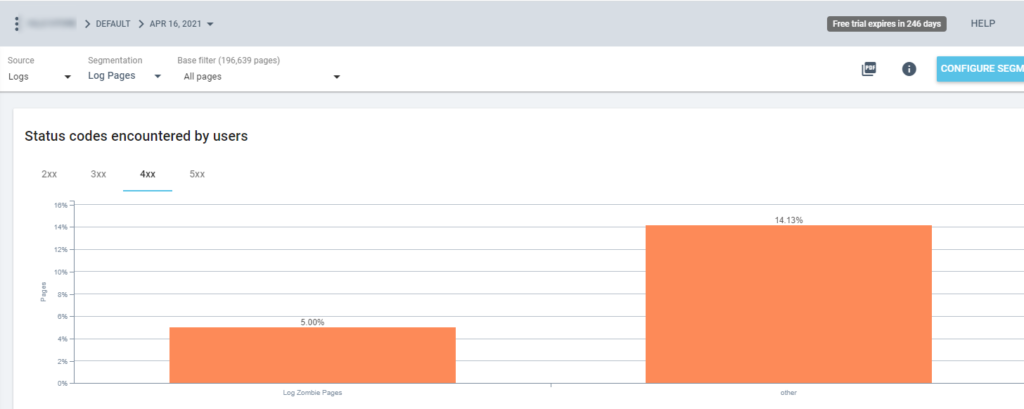
So now we can use this segmentation in all Oncrawl reports. This lets us obtain insights from any graphic, for example: how many “log zombie pages” return a 200 status code?
Orphan pages
For me, the “Orphan pages” worth looking at carefully are all the pages that have hight value on important metrics (GA Session, GSC Impression, Log hits, …) that don’t have any internal links pointing to them to share page rank and indicate page importance.
As with the “Zombie pages”, to create a log-based report, the best way is to create a new segmentation.
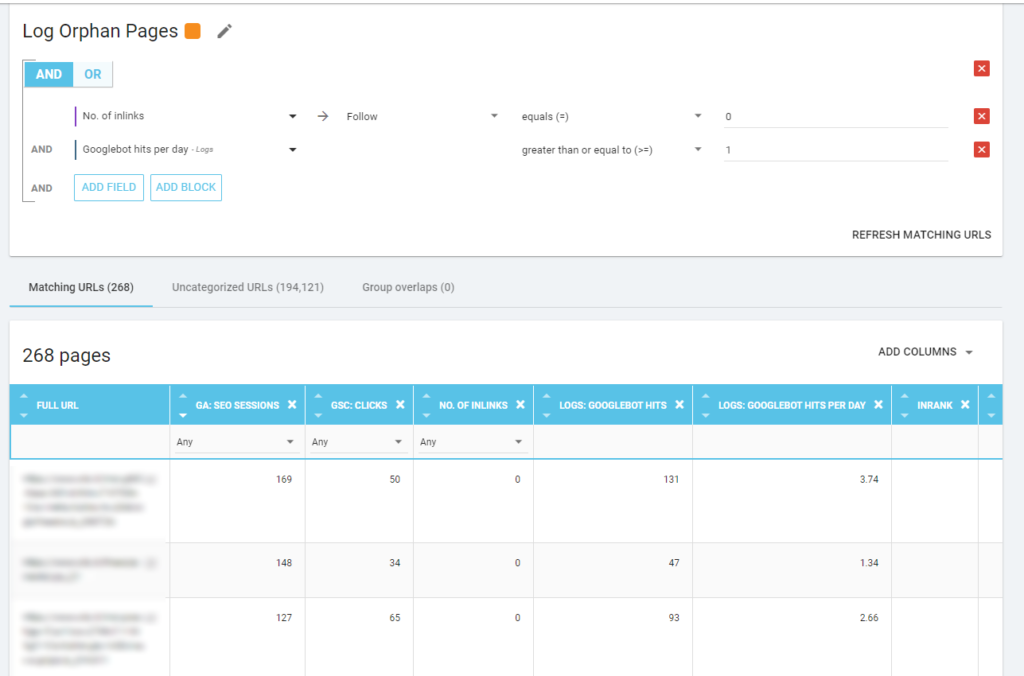
WOW, what a lot of pages with sessions and hits and without inlinks!
When checking a report based on “Zero Follow Inlinks” please pay attention to the crawling status: was Oncrawl able to crawl all the site, or only a few pages? You can see this on the project’s main page:
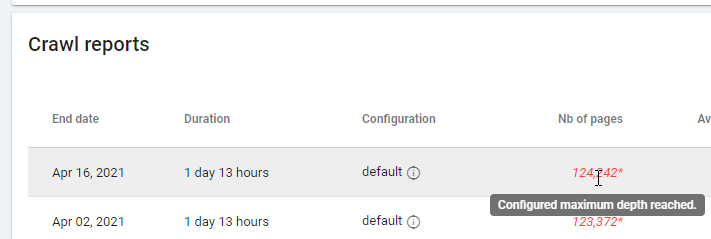
If the maximum depth has been reached:
- Check your crawl configuration
- Check your site structure
Log files and Oncrawl
What does Oncrawl offer in its default dashboards?
Live log
This dashboard is useful for checking key information about how bots are reading your sites, as soon as the bots visit the site and before the information from log files are completely processed. To get the most out of it, I recommend uploading log files frequently: you can do it via FTP, through connectors such as the one for Amazon S3, or you can do it manually via the web interface.
The first chart shows how frequently your site is read, and by which bot. In the example you can see below, we can check desktop vs mobile accesses. In this case, we sent to Oncrawl the log files filtered only for Googlebot:
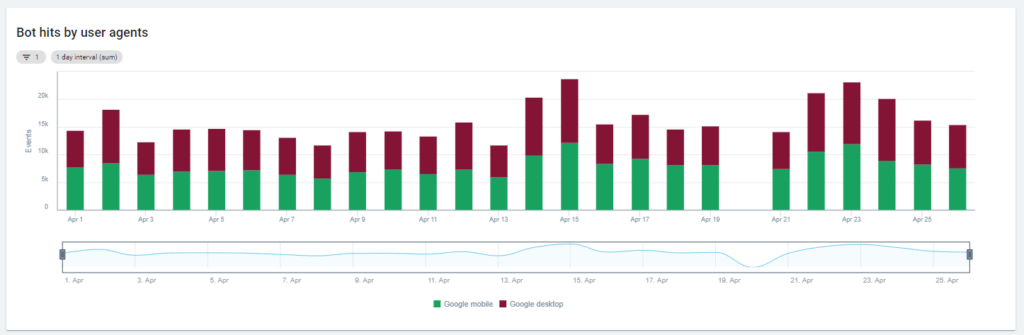
It’s interesting to see how the amount of mobile reads is still very high: is it normal? It depends… The site we’re analyzing is still in “mobile-first index” but it isn’t a fully responsive website: it’s a dynamic serving website (as Google calls it) and Google still checks both versions!
Another interesting diagram is “Bot hits by page group”. By default, Oncrawl creates groups based on URL paths. But we can set groups manually in order to group the URLs that make the most sense to analyze together.
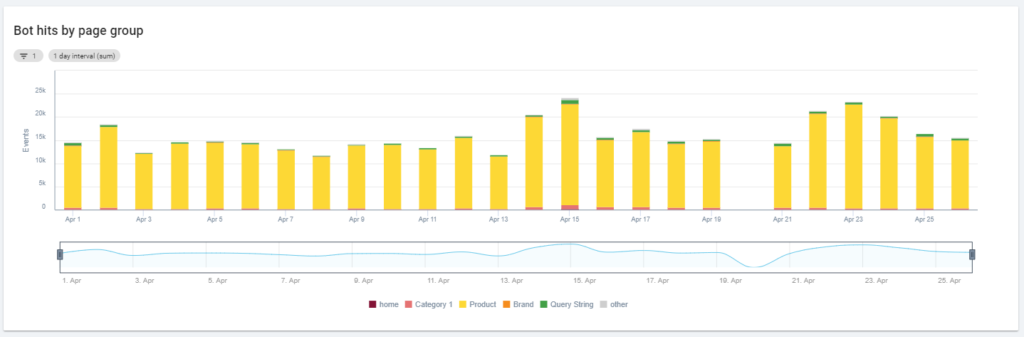
As you can see, the yellow wins! It represents URLs with a product path, so it’s normal for it to have such a high impact, particularly since we have Google paid Shopping campaigns.
And… yes, we’ve just confirmed that Google uses the standard Googlebot to check product status related to the merchant feed!
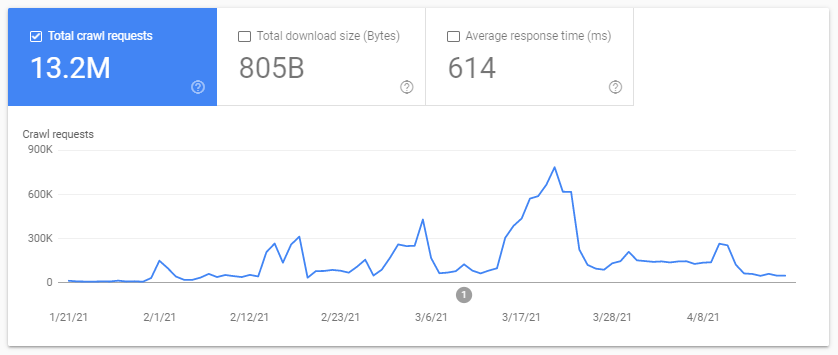
Crawl behavior
This dashboard shows similar information to “Live log” but this information has been fully processed and is aggregated by day, week, or month. Here you can set a date period (start/end), which can go back in time as far as you want. There are two new diagrams to further on log analysis:
- Crawl behavior: to check the ratio between pages crawled and pages newly crawled
- Crawl frequency per day
The best way to read these diagrams is to connect the results to site actions:
- Did you move pages?
- Did you update some sections?
- Did you publish new content?
SEO impact
For SEO, it is important to monitor whether optimized pages are read by bots or not. As we wrote about “orphan pages”, it’s important to ensure that the most important/updated pages are read by bots so that the most updated info is available to search engines to be rankable.
Oncrawl uses the concept of “Active pages” to indicate the pages that receive organic traffic from the search engines. Starting from this concept, it shows some basic numbers, such as:
- SEO visits
- SEO active pages
- SEO active ratio (the proportion of active pages among all the pages crawled)
- Fresh Rank (the average time that passes between when the bot first reads the page and the first organic visit)
- Active pages not crawled
- Newly active pages
- Crawl frequency per day of active pages
As is Oncrawl’s philosophy, with a single click, we can go deep into the information lake, filtered by the metric we clicked on! For example: which are the active pages not crawled? One click…
Exploration sanity
This last dashboard allows us to check the quality of the bo’s crawling, or more accurately, how well the site presents itself to search engines:
- Status code analysis
- Status code analysis by day
- Status code analysis by page group
- Response time analysis
It’s mandatory for good SEO work to:
- reduce the number of 301 responses from internal links
- remove the 404/410 responses from internal links
- optimize the response time, because the Googlebot crawl quality is directly related to the response time: try to reduce the response time on your site by half and you will see (in a few days) that the quantity of crawled pages willdouble.
[Ebook] Four Use Cases to Leverage SEO Log Analysis

The science of Log Analysis and Oncrawl’s Data Explorer
So far we have seen the standard Oncrawl reports and how to use them to obtain custom information via segmentations and page groups.
But the core of log analysis is to understand how to find something wrong. Usually, the starting point of the analysis is to check peaks and compare them with traffic and with your objectives:
- most crawled pages
- least crawled pages
- most crawled resources (not pages)
- crawling frequencies by type of file
- impact of the 3xx / 4xx status codes
- impact of 5xx status codes
- slower crawled pages
- …
Do you want to go deeper? Good… you need to add data. And Oncrawl offers a really powerful tool like Data Explorer.
As you can see in a previous screenshot (active pages not crawled), you can create all the reports you want based on your analysis framework.
For example:
- worst organic traffic pages with a lot of crawl by bots
- best organic traffic pages with too much crawl by bots
- slower pages with a lot of SERP impressions
- …
Below you can see how I’ve checked which are the most crawled pages related to their number of SEO sessions:
Takeaways
The log analysis isn’t strictly technical: to do it in the best possible way we need to combine technical skills, SEO skills and marketing skills.
Too often, an analysis is excluded from an “SEO checklist” because our customer doesn’t have access to log files or because it can be a costly analysis.
The reality is that the logs are the only sources to really check where bots are going on our sites, and to know how our servers are responding to them.
A tool like Oncrawl can greatly reduce the technical requirements: just upload the log files and start analyzing them!