As an SEO or a digital marketer, you’re probably a little more than familiar with performance metrics… We won’t go as far to say obsessed, but you likely know a thing or two about them.
In the current, and highly competitive online marketplace, site owners are always on the lookout for ways to improve their SEO performance and one way to do that is through page speed performance.
But what tools or techniques are you using to measure those things? Common options include Google Lighthouse and window.performance.
In this article, we will explore how both tools can be used to test website performance when faced with different network connections. We will also look at a code example that uses Puppeteer, a Node.js library for controlling headless Chrome or Chromium browsers, to run tests on a website’s performance using different network scenarios.
However, before we get into the specifics of how to run the code we mentioned above, let’s first take a quick look at the differences between Google Lighthouse and window.performace and how they are used.
What is Google Lighthouse?
Lighthouse is an open-source tool developed by Google that helps developers improve the quality of web pages. It does so by auditing various metrics which are divided into the categories of performance, accessibility, SEO, best practices and progressive web app (PWA). Lighthouse provides a detailed report on the website’s performance and offers recommendations for improvement.
Lighthouse can be run from the command line or from within the Chrome DevTools or you can use the command-line interface (CLI) to automate testing and generate reports. The metrics it measures are very similar to those of the Core Web Vitals including First Contentful Paint (FCP), Speed Index, Largest Contentful Paint (LCP), Interactive, and Total Blocking Time (TBT).
What is window.performance?
Window.performance, on the other hand, is a JavaScript API that provides information about a website’s loading and access to performance-related information about the current web page.
It includes metrics such as navigation timing, resource timing, and user timing and they are also used by tools, such as Lighthouse, to generate performance reports.
The window.performance object has several properties and methods. Some of the most commonly used ones are:
- performance.timing: An object that provides timing information about various events in the page load process, such as the time it takes to receive the first byte of the response, the time it takes to render the page, and the time it takes for the page to become interactive.
- performance.mark(): A method that allows developers to create named marks in the performance timeline, which can be used to measure the time between two events.
- performance.measure(): A method that allows developers to create named measures in the performance timeline, which can be used to measure the time between two marks or between a mark and a predefined point in time.
Ultimately, both window.performance and Lighthouse are effective tools for measuring and optimizing website performance but whereas window.performance provides low-level metrics that can be used to measure specific aspects of page load, Lighthouse provides a more comprehensive overview of page performance and provides actionable improvement recommendations.
By using both tools together, you can gain a deeper understanding of website performance and make targeted improvements to enhance user experience.
What are the benefits of using an API for your performance testing?
You may be wondering, if Lighthouse or window.performance already have integrated tools you can use for testing, why turn to the API? That’s a great question and we’ll take a quick look at why before we get into the nitty gritty of how to run your tests.
Basically, it comes down to needing more in-depth results and customized reports that fit your specific needs. Sometimes, you may need to test your website using very specific conditions, such as different networks.
As you know, you can test each of your web pages using Lighthouse tools in Chrome DevTools; however, by utilizing the Lighthouse API, you can customize your tests and conduct them using different approaches and subsequently generate customized reports to compare different metrics.
FYI: The Lighthouse UI version in Chrome cannot provide us with customized results.
Getting started with network connections
Now that we’ve introduced the idea of testing for network connection, let’s run with that throughout the rest of the article. It’s an important element to look at as it can significantly impact your page speed performance.
According to the following case study I conducted, we measure different performance metrics implementing various network connections, but why?
For many large-scale or international websites, you’ll have diverse audiences scattered around the globe. With each different location comes different network connections and testing your web pages with various networks will help understand and improve the overall user experience.
Your testing should ultimately aim to answer the following questions:
- Does our website perform well with different network connections?
- What is the impact on performance metrics like LCP and FID with different networks?
- How do our performance metrics impact the user requests we receive?
How to test Lighthouse and window.performance taking into account different network connections
Let’s get started with testing.
Considering the weight page speed carries in search engine ranking and user experience, it’s helpful to know how your site performs with different connection types.
To achieve this, you can use both Lighthouse and window.performance in conjunction with Puppeteer. Below, we will provide specific code to test site performance and explain, step-by-step, how to run it. For this specific project, you will need to install the Puppeteer, Lighthouse, and FS.
[Case Study] How OMIO uses Oncrawl to improve website quality
Determine the type of network connection you want to test
Before running any code, it would be beneficial to determine which network connection types you wish to test
To do so, you can use the Network Information API, which is available in many browsers. The API provides information such as the effective type of the connection and the maximum downlink speed of the connection.
The effective type property of the API returns a string indicating whether the connection is “slow-2G“, “2G“, “3G“, “4G“, or “5G“. The effective type is determined based on the current network conditions, such as the network’s signal strength, bandwidth and latency.
Here’s an example of how to use the API to retrieve the information we’re looking for:
 if ('connection' in navigator) {

const connection = navigator.connection;

console.log('Effective network type: ' + connection.effectiveType);

}
The Network Information API also provides other, more detailed, connection information such as downlink and round-trip time (rtt):
 if ('connection' in navigator) {

const connection = navigator.connection;

console.log('Downlink speed: ' + connection.downlink + ' Mbps');

console.log('Round-trip time: ' + connection.rtt + ' ms');

}
In addition to the Network Information API method, you can measure the time it takes to download a small file or measure the time it takes to load a webpage with a known size in order to estimate the user’s network connection type. Keep in mind though that these techniques can produce less accurate results and may not work in all cases.
Knowing the user’s network connection type will limit the number of tests we will have to run. We can stick to a small range concentrated around the explicitly identified network connection level we just determined.
Testing the different network connections
The code provided below simulates several predefined network conditions, such as a slow 3G network connection, fast 3G connections, and offline. Subsequently, the code loops through each type of network to test site performance.
The results of each test are recorded in a JSON file, which includes website performance metrics such as those we listed above (FCP, Speed Index, LCP, etc.) These tests will help to clearly identify where your performance issues lie.
To run the code, you need to install the required dependencies: Puppeteer, Lighthouse, and fs. You can then save the code to a JavaScript file and run it using a command-line interface such as Node.js.
 import fs from 'fs';

import puppeteer from 'puppeteer';

import { PredefinedNetworkConditions } from 'puppeteer';

import lighthouse from 'lighthouse';

(async () => {

const networks = {

'Slow 3G': PredefinedNetworkConditions['Slow 3G'],

'Fast 3G': PredefinedNetworkConditions['Fast 3G'],

'Offline': PredefinedNetworkConditions['Offline'],

'GPRS': PredefinedNetworkConditions['Regular 2G'],

'Regular 2G': PredefinedNetworkConditions['Regular 2G'],

'Good 2G': PredefinedNetworkConditions['Good 2G'],

'Regular 3G': PredefinedNetworkConditions['Regular 3G'],

'Good 3G': PredefinedNetworkConditions['Good 3G'],

'Regular 4G': PredefinedNetworkConditions['Regular 4G'],

'DSL': PredefinedNetworkConditions['DSL'],

'WiFi': PredefinedNetworkConditions['WiFi'],

'Ethernet': PredefinedNetworkConditions['Ethernet']

};

const results = {};

for (const [name, network] of Object.entries(networks)) {

console.log(`Testing with network: ${name}`);

const dataset = [];

const index = [];

const lighthouseResults = [];

for (let i = 0; i < 8; i++) {

const browser = await puppeteer.launch();

const page = await browser.newPage();

await page.emulateNetworkConditions(network);

await page.goto('https://revivoto.com', { timeout: 50000 });

const performanceTiming = JSON.parse(await page.evaluate(() => JSON.stringify(window.performance.timing)));

const navigationStart = performanceTiming.navigationStart;

const loadEventEnd = performanceTiming.loadEventEnd;

const loadTime = loadEventEnd - navigationStart;

console.log(`Page loaded in ${loadTime} milliseconds`);

dataset.push(loadTime);

index.push(i);

// Run Lighthouse

const lighthouseConfig = {

onlyCategories: ['performance'],

port: new URL(browser.wsEndpoint()).port || 0

};

const lighthouseResult = await lighthouse('https://example.com', lighthouseConfig);

const { firstContentfulPaint, speedIndex, largestContentfulPaint, interactive, totalBlockingTime } = lighthouseResult.lhr.audits;

lighthouseResults.push({

firstContentfulPaint: firstContentfulPaint,

speedIndex: speedIndex,

largestContentfulPaint: largestContentfulPaint,

interactive: interactive,

totalBlockingTime: totalBlockingTime

});

await browser.close();

}

results[name] = { dataset, index, lighthouseResults };

}

console.log(results);

// Write results to a JSON file

fs.writeFileSync('result.json', JSON.stringify(results));

})().catch(error => console.error(error));
How to run the code
Open your terminal and navigate to the directory where you would like to save the code.
1. Install Node.js and npm if you haven’t already.
2. Create a new folder and navigate into it.
3. Initialize a new Node.js project with the following command: npm init
4. Install the necessary dependencies with the following command: npm install puppeteer lighthouse fs
5. Copy and paste the code you provided into a new file named “index.js” within your project folder.
6. Comment out the network conditions you want to test. For example, if you want to test the Regular 2G network condition, uncomment the following line:
// ‘Regular 2G’: PredefinedNetworkConditions[‘Regular 2G’],
7. Save the changes to the file.
8. In your terminal, run the following command to start the script: node index.js
9. Wait for the script to finish running. This may take several minutes, depending on how many network conditions you are testing and how many times you are running each test.
10. Once the script is finished, a new file named “result.json” will be created in your project folder. This file will contain the results of the tests.
That’s it! You have successfully run the code and below are the generated test results for different networks using Lighthouse and window.performance.
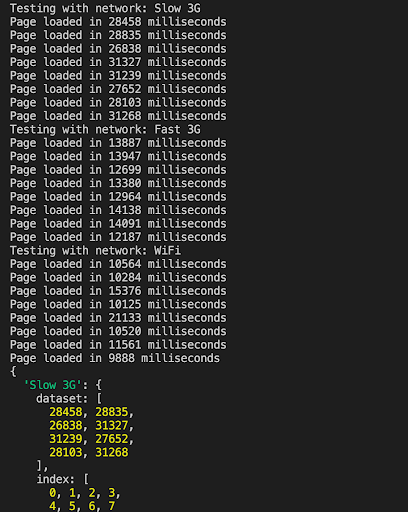
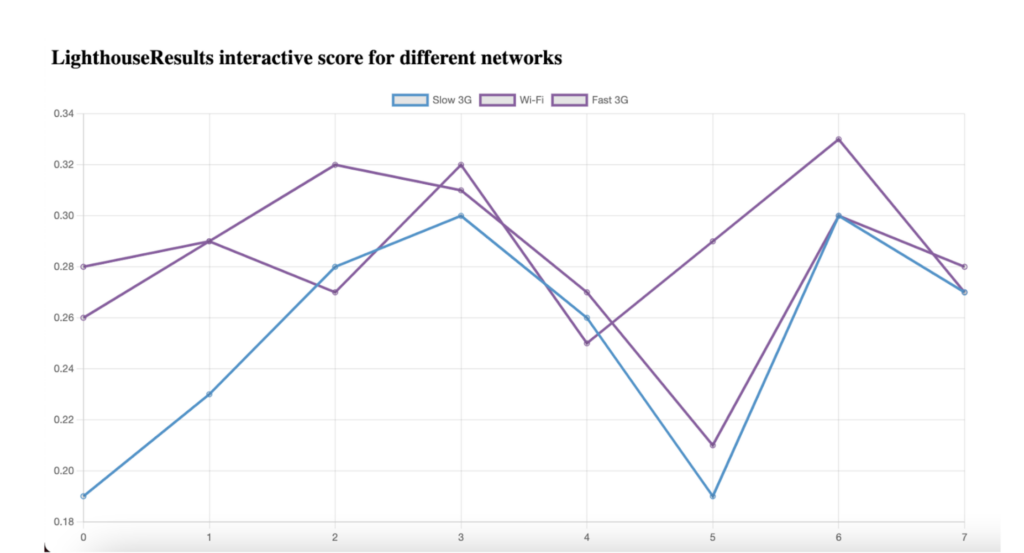
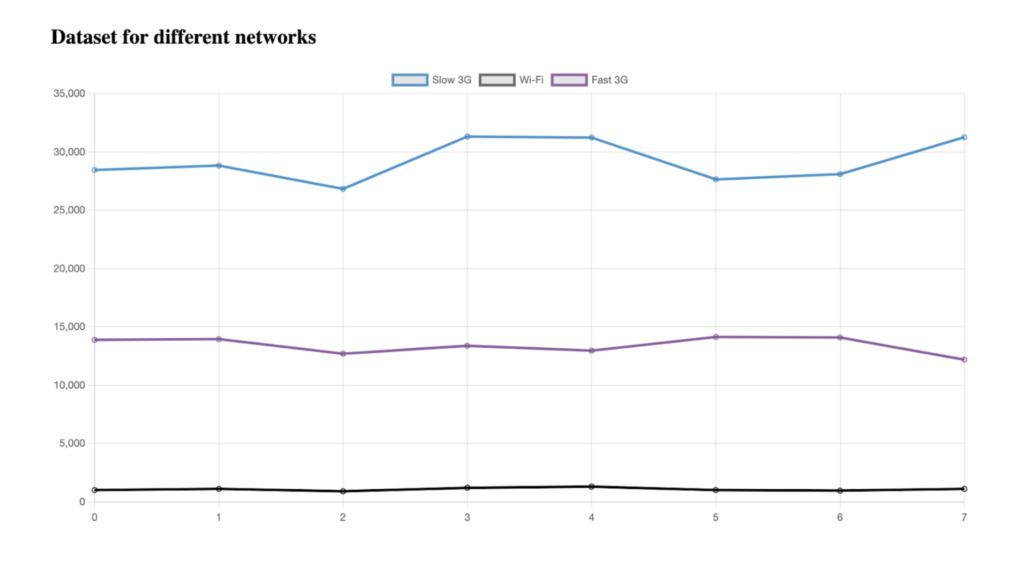
Why running performance tests multiple times is a good idea
If running one test is a good idea, think about how useful it could be to run tests multiple times. Essentially, running your performance tests multiple times can be useful if you wish to gather more accurate insights in regards to statistical significance, performance trends and other comparative elements. It allows you to collect more data points and obtain a better understanding of the website’s performance from different angles.
Statistical significance
Running the test multiple times helps you establish statistical significance in your results. With the data you collect from multiple runs, you can calculate average values, identify outliers, and assess the consistency of performance metrics.
Variability assessment
Websites can exhibit performance variability due to various factors, such as network congestion, server load, or caching. Multiple test runs provide the opportunity to observe the range of performance results and identify any significant variations.
Performance trends
Test runs conducted over an extended period of time allows you to observe performance trends. You can analyze the data to identify patterns, such as improvements or deteriorations in performance over iterations. This information can be valuable for tracking the impact of optimizations or identifying potential performance regressions.
Benchmarking
Performing any tests multiple times can also help you establish a performance benchmark. When you compare the results across different runs, you can identify the average or best-case performance metrics. This benchmark can in turn serve as a reference point for future comparisons or optimizations, helping you track progress and set performance goals.
Reliability testing
By varying the types of network connections across multiple tests, you can evaluate the reliability of your site’s performance in both favorable and challenging scenarios. You can ultimately identify potential bottlenecks or areas where the website’s performance may degrade significantly.
Performance testing case study: Booking.com, TripAdvisor.com, and Google.com
To clarify the impact of different networks on user experience and page speed, let’s take a look at a quick LCP test example I ran on Booking.com and TripAdvisor using different network connections.
To run similar tests, all you need to do is open your Chrome browser and go to Chrome Dev Tools, then navigate to the Performance tab. After reloading the page, look for the Largest Contentful Paint (LCP) metric. You can change your network conditions and run the test again to see how LCP values vary under different network settings.
The LCP metric was used to measure the time it takes for the largest element on the page to become visible to the user. Below is the code I used and you can also use this code to test your own website.
 import fs from 'fs';
import puppeteer from 'puppeteer';
import { PredefinedNetworkConditions } from 'puppeteer';
import lighthouse from 'lighthouse';

(async () => {
const networks = {
'Slow 3G': PredefinedNetworkConditions['Slow 3G'],
'Fast 3G': PredefinedNetworkConditions['Fast 3G']
// // 'Offline': PredefinedNetworkConditions['Offline'],
// // 'GPRS': PredefinedNetworkConditions['Regular 2G'],
// 'Regular 2G': PredefinedNetworkConditions['Regular 2G'],
// // 'Good 2G': PredefinedNetworkConditions['Good 2G'],
// 'Regular 3G': PredefinedNetworkConditions['Regular 3G'],
// // 'Good 3G': PredefinedNetworkConditions['Good 3G'],
// 'Regular 4G': PredefinedNetworkConditions['Regular 4G']
};
const results = {};

for (const [name, network] of Object.entries(networks)) {
console.log(`Testing with network: ${name}`);
const dataset = [];
const index = [];
const lighthouseResults = [];

for (let i = 0; i < 4; i++) {
const browser = await puppeteer.launch();
const page = await browser.newPage();
await page.emulateNetworkConditions(network);
await page.goto('https://www.google.com/', { timeout: 60000 });

const performanceTiming = JSON.parse(await page.evaluate(() => JSON.stringify(window.performance.timing)));
const navigationStart = performanceTiming.navigationStart;
const loadEventEnd = performanceTiming.loadEventEnd;
const loadTime = loadEventEnd - navigationStart;
console.log(`Page loaded in ${loadTime} milliseconds`);
dataset.push(loadTime);
index.push(i);

// Run Lighthouse
const lighthouseConfig = {
onlyCategories: ['performance'],
port: new URL(browser.wsEndpoint()).port || 0,
};
const lighthouseResult = await lighthouse('https://google.com', lighthouseConfig);
const { audits } = lighthouseResult.lhr;

const lcpAudit = audits['largest-contentful-paint'];
const lcpMetric = lcpAudit ? lcpAudit.numericValue : null;

lighthouseResults.push({
largestContentfulPaint: lcpMetric,
});

await browser.close();
}

results[name] = { dataset, index, lighthouseResults };
}

console.log(results);

// Write results to a JSON file
fs.writeFileSync('lcresult.json', JSON.stringify(results));
})().catch((error) => console.error(error));
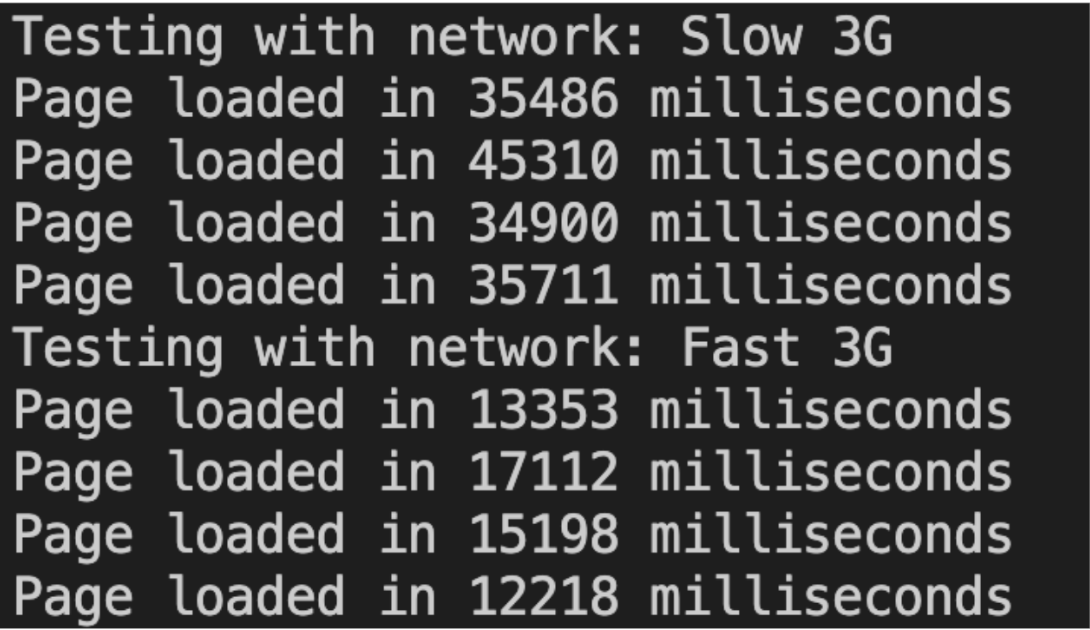
Below are the screenshots of the different results. The insights you can glean from such tests help you understand the behavior of your server and its impact on LCP and other performance metrics.
TRIPADVISOR.COM
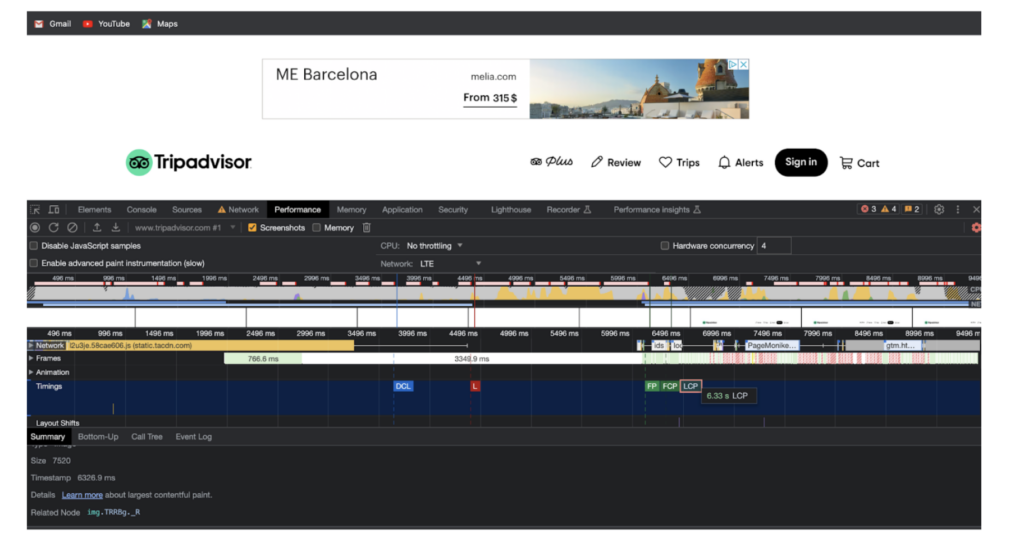
Tripadvisor LCP on LTE
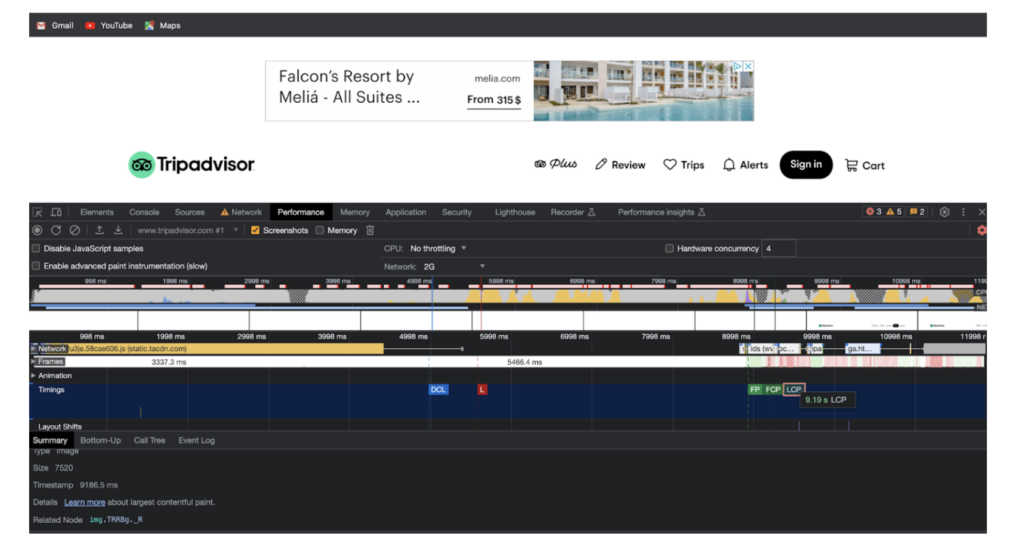
Tripadvisor LCP on 2G
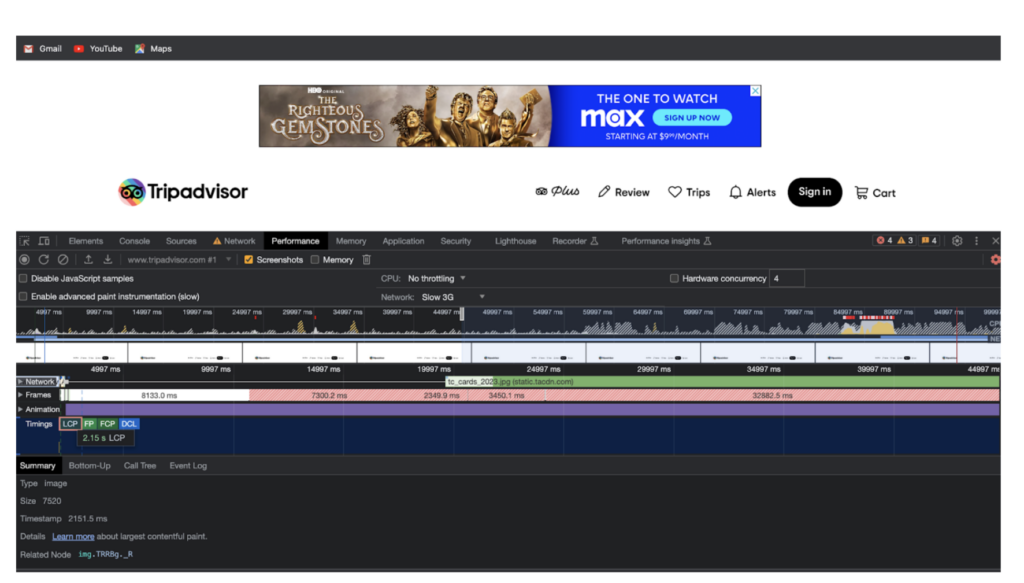
Tripadvisor LCP on Slow 3G
Result of script on Tripadvisor.com:
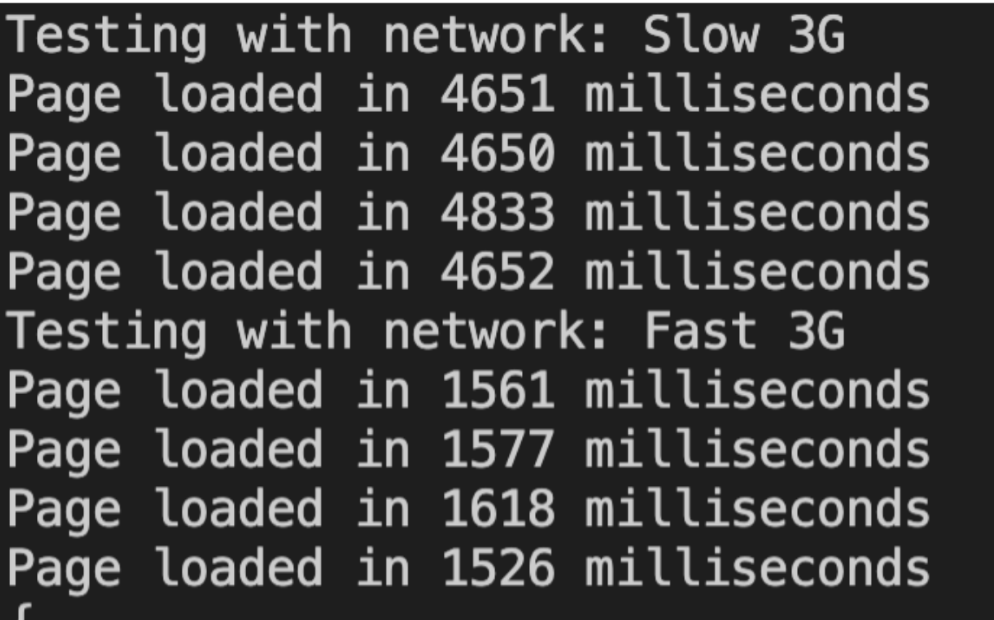
{"Slow 3G":{"dataset":[4651,4650,4833,4652],"index":[0,1,2,3],"lighthouseResults":[{"largestContentfulPaint":5191.479},{},{},{}]},"Fast 3G":{"dataset":[1561,1577,1618,1526],"index":[0,1,2,3],"lighthouseResults":[{},{},{},{}]}}
Script log for Tripadvisor.com:
BOOKING.COM
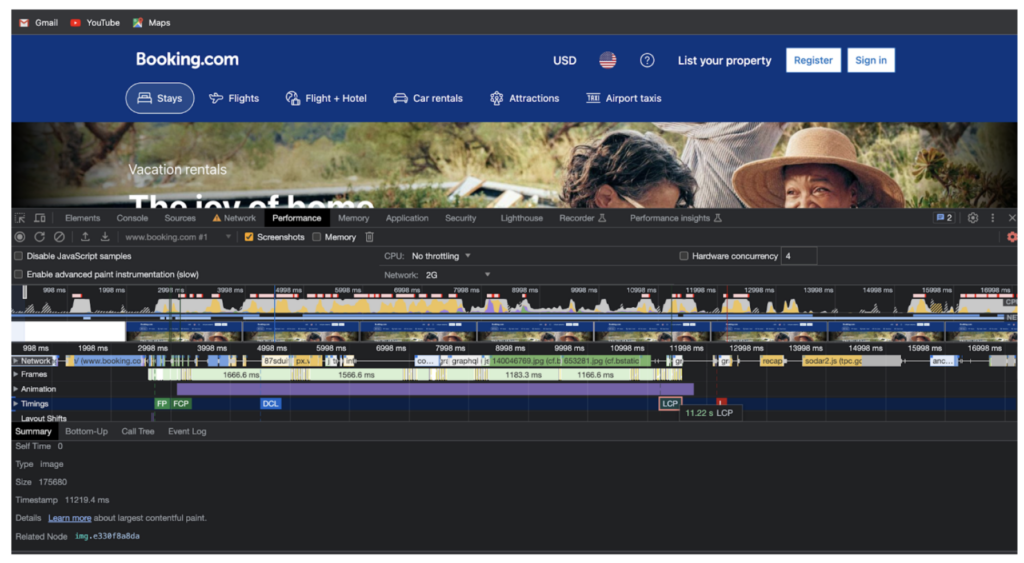
Booking LCP on 2G
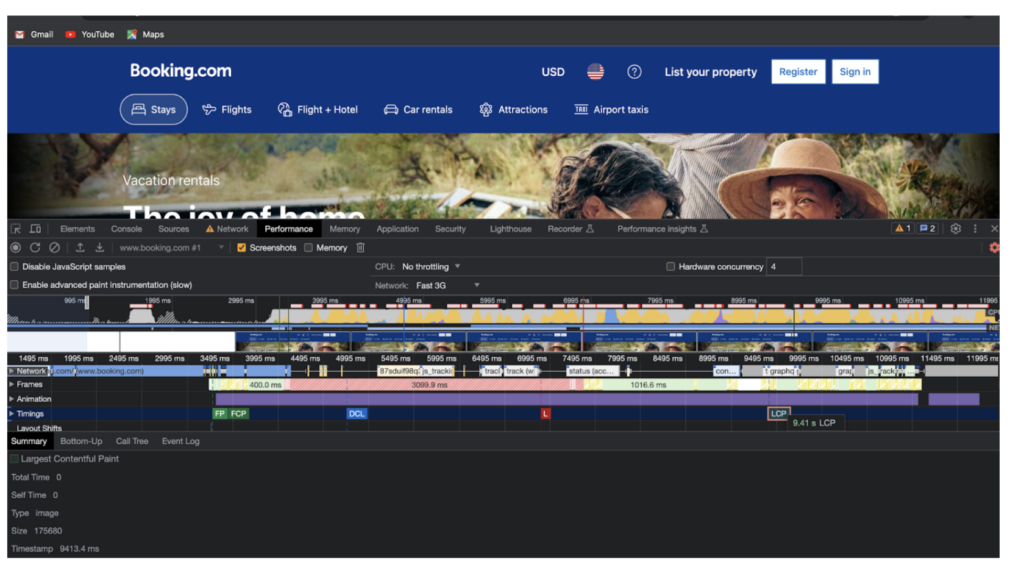
Booking LCP on Fast 3G
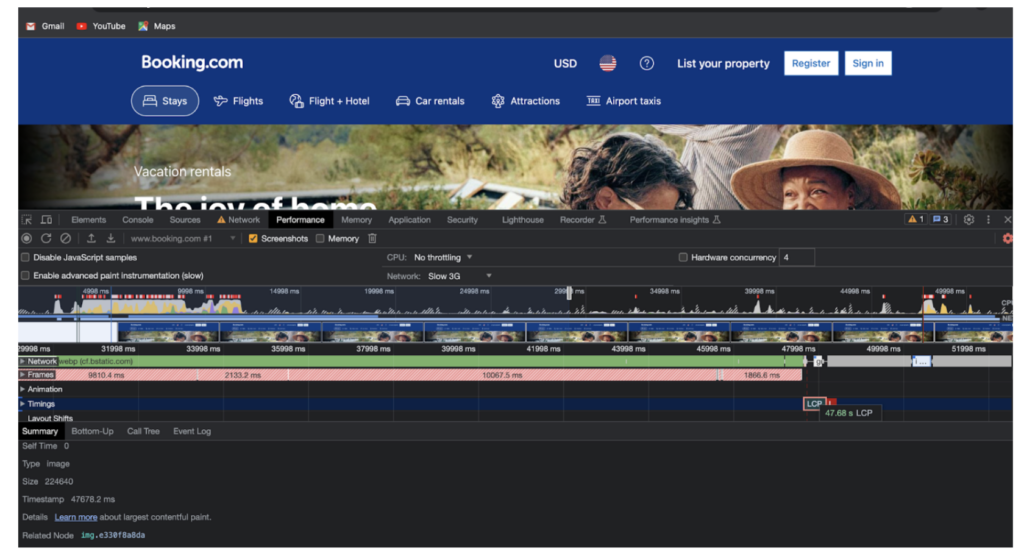
Booking LCP on Slow 3G
Result of script on Booking.com:
{"Slow 3G":{"dataset":[4651,4650,4833,4652],"index":[0,1,2,3],"lighthouseResults":[{"largestContentfulPaint":5191.479},{},{},{}]},"Fast 3G":{"dataset":[1561,1577,1618,1526],"index":[0,1,2,3],"lighthouseResults":[{},{},{},{}]}}
Script log for Booking.com:
GOOGLE.COM
In a similar test, I used new code to test LCP on Google.com.
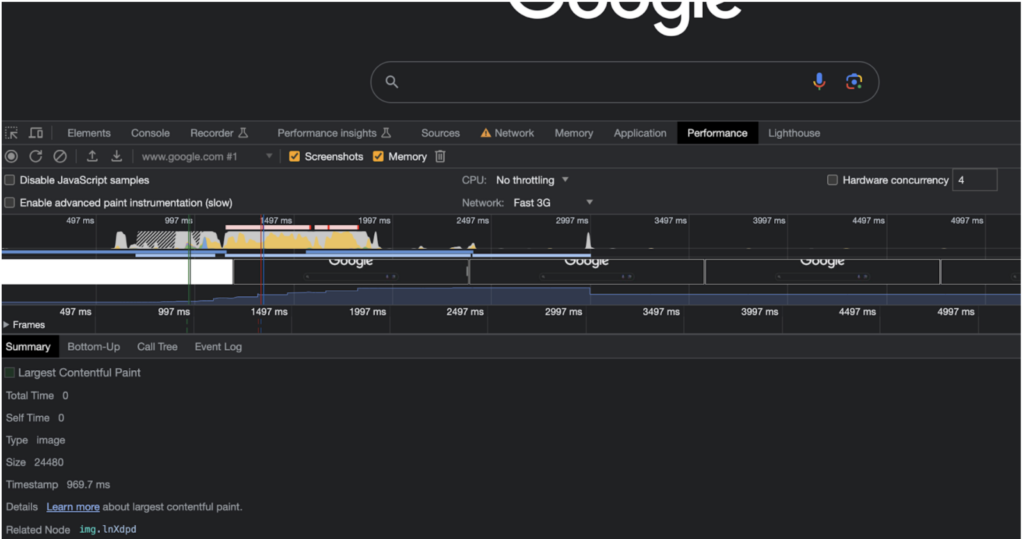
Google LCP on Fast 3G
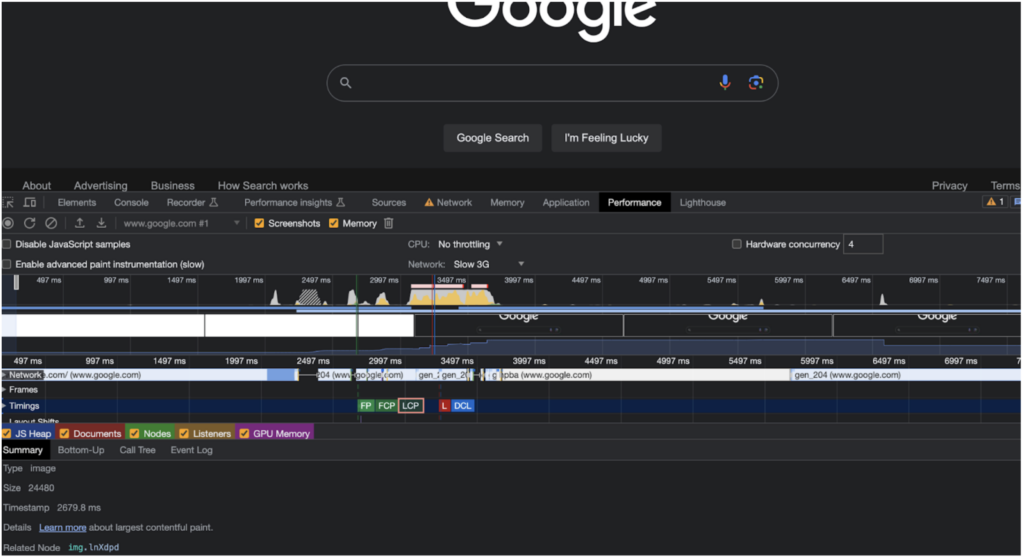
Google LCP on Slow 3G
Result of script on google.com:
{"Slow 3G":{"dataset":[30829,27400,46015,36011],"index":[0,1,2,3],"lighthouseResults":[{"largestContentfulPaint":4540.699},{"largestContentfulPaint":4721.181},{"largestContentfulPaint":5090.5875},{"largestContentfulPaint":5844.249}]},"Fast 3G":{"dataset":[25100,33708,29554,27332],"index":[0,1,2,3],"lighthouseResults":[{"largestContentfulPaint":4528.835000000001},{"largestContentfulPaint":5801.967},{"largestContentfulPaint":5325.841},{"largestContentfulPaint":5612.5551}]}}
Let’s examine the results for Google.com in more depth.
Slow 3G Network:
- The “largestContentfulPaint” values for the ‘Slow 3G’ network range from 4540.699ms to 5844.249ms.
- The trend suggests that the largest element on the page takes a relatively longer time to become visible compared to the ‘Fast 3G’ network.
- Note that the ‘Slow 3G’ network indicates slower speeds and potentially higher latency, leading to a slower page rendering experience.
Fast 3G Network:
- The “largestContentfulPaint” values for the Fast 3G network range from 4528.835ms to 5801.967ms.
- The trend shows that the largest element on the page becomes visible faster compared to the ‘Slow 3G’ network.
- The ‘Fast 3G’ network implies relatively faster network speeds and lower latency, resulting in a quicker page rendering experience compared to the Slow 3G.
Based on these insights, it is evident that network connection significantly impacts LCP, which directly affects the user experience.
By considering the performance data and trends for different networks, web developers can focus on strategies that include optimizing resource sizes, minimizing network requests, implementing caching techniques, and prioritizing the critical rendering path.
Regularly monitoring performance data and conducting tests with various configurations helps ensure optimal performance across different scenarios and provides an optimal user experience.
Implementing performance-driven SEO strategies
In today’s digital landscape, users expect websites to load quickly and provide seamless navigation, regardless of their network connection. Slow-loading pages not only frustrate visitors but also impact search engine rankings.
By now, we’ve established that optimizing website performance is crucial. But how does this play a role in developing our SEO strategy?
Looking at the different elements from our analyses, we can gather valuable insights that allow us to analyze various aspects of the user experience and the relationship between page rank and performance.
For UX analysis, we can collect metrics like page load times, interactive elements, and user engagement. Or for page rank, we can track changes in rankings over time and correlate them with other data points, such as page load times or user engagement metrics.
When we monitor these metrics over time, we are better able to identify trends, patterns, and areas for improvement. By combining and comparing all this data, we gain a holistic understanding of our site performance that empowers us to make data-driven decisions and prioritize optimization efforts accordingly.
Tips & Resources
There are a number of different methods that one can employ to optimize page speed and performance. Below I have listed a few tips and resources that you can examine and test. Every site is different, so it might take some trial and error to find what works best for your site.
Code splitting
Code splitting is a technique used to divide your JavaScript code into smaller, more manageable chunks. By employing code splitting, you can optimize the initial load time of your website by only loading the code that is required for the current page.
Frameworks like React, Vue, and Nuxt.js provide built-in support for code splitting. For example, in React, you can use React.lazy and React Suspense to dynamically load components when needed.
- React: You can find more information here: React Code Splitting
- Vue: Here’s the official documentation: Vue Router Lazy Loading
- Nuxt.js: You can learn more here: Code Splitting in Nuxt.js
Data compression
Data compression helps optimize website performance by reducing the size of files transmitted over the network. Gzip and Brotli are commonly used compression techniques that compress HTML, CSS, and JavaScript files.
Gzip is widely supported and can be easily enabled on web servers, while Brotli provides even higher compression ratios but requires server-side configuration.
- Enable Gzip compression on your server. Most servers have built-in support for Gzip compression. Here’s an article on how to enable it: Enabling Gzip Compression
- If your server supports it, consider using Brotli compression. Here’s an article explaining how to enable it: Enabling Brotli Compression
Font loading
Font loading optimization works to deliver a fast and visually consistent experience. The Font Face Observer library is a popular choice for this task. It allows you to define font-loading behavior, such as swapping fonts only when they have fully loaded or displaying fallback fonts to avoid layout shifts.
- Use the Font Face Observer library to control the loading and display of fonts. You can find the library and usage examples here: Font Face Observer
External dependency management
Tools like Webpack Bundle Analyzer can help analyze your bundle size and identify problematic dependencies. With such a tool, you can minimize the size of your JavaScript bundles and improve load times.
Be sure to carefully evaluate the necessity of each dependency and consider alternative lightweight libraries or custom implementations when possible.
Caching dynamic content
Caching dynamic content reduces the load on the server and minimizes response times. Techniques like server-side caching using Redis or Memcached allow you to cache frequently accessed data, responses, or database queries.
By serving cached content instead of dynamically generating it for each request, you’ll improve the overall responsiveness of your website, especially for users accessing dynamic content on slower network connections.
- Redis: Redis is an in-memory data store that can be used for caching frequently accessed data. Learn more here: Redis
- Preload: Use the `<link rel=”preload”>` attribute to prioritize critical resources. You can find more information here: rel=preload
- Implement HTTP/2 on your server to leverage its faster and more efficient data transfer capabilities. Most modern web servers support HTTP/2 by default.
Use a content delivery network (CDN)
Consider using a CDN like Cloudflare, Fastly, or Akamai to deliver static content such as CSS, JS, and images. CDNs cache content in multiple locations worldwide, reducing latency and improving load times.
Optimize database queries
Ensure your database queries are optimized by using proper indexes, avoiding unnecessary joins or complex queries, and minimizing the number of database round trips. This helps reduce the time it takes to retrieve data from the database.
Minimize the use of redirects
Minimize the number of redirects on your website as each redirect adds additional HTTP requests and increases load times. Ensure that redirects are used efficiently and only when necessary.
Enable browser caching
Set appropriate caching headers (e.g., Cache-Control, Expires) for static resources like CSS, JS, and images. This allows the user’s browser to cache these files for a specified period, reducing the number of requests made to the server for subsequent visits.
Use asynchronous loading
Load non-essential JavaScript asynchronously using techniques such as the async attribute or dynamic script loading. This prevents JavaScript from blocking other resources, allowing the page to render faster, even if the JavaScript is still loading.
Optimize critical rendering path
Ensure that critical resources like CSS and JavaScript required for initial rendering are loaded and parsed quickly. Eliminate render-blocking resources by inlining critical CSS or using techniques like script preloading, async/defer attributes, or modern bundlers like Webpack.
Conclusion
Understanding which network conditions have an impact on your site’s performance is the first step to being able to optimize your site and improve your metrics.
Now that you have an idea of what’s slowing you down, here’s a recap of the steps you can take to better your page performance.
- Identify the networks that are impacting your website’s performance the most. You can use the dataset array from the code to compare the page load times for different network conditions.
- Analyze the Lighthouse results to identify which metrics are underperforming. For example, if the Speed Index metric is poor for a particular network connection, you can focus on optimizing this metric.
- Focus on the changes that can have a significant impact on performance including optimizing images and videos, minifying and compressing code, reducing server response times, and implementing caching strategies.
- Repeat the process by testing the website again using different conditions and running Lighthouse to measure the impact of your optimization efforts.
- Rinse and repeat until you have achieved satisfactory performance across all network connections.
It’s important to note that optimizing performance for one type of network does not necessarily mean you’ll improve performance across all types. Therefore, keep testing and making improvements across the board to ensure a consistently positive user experience for all your site’s visitors.
Let us know if you try the code and how it works for you in the comments section!


