Most comprehensive digital marketing strategies recommend a balance of SEA (paid advertising) and SEO (organic) strategies, as studies have shown that paid and organic results together produce better results than either can accomplish alone.
Using Oncrawl’s data ingestion, we’ll show you how to get the most out of this synergy:
- Use analysis of the SEO of SEA landing pages to boost your Quality Score
- Run a cross-comparison of rankings and investments to spot over-investing
- Tracking CTRs for both SEA and SEO campaigns in a single view.
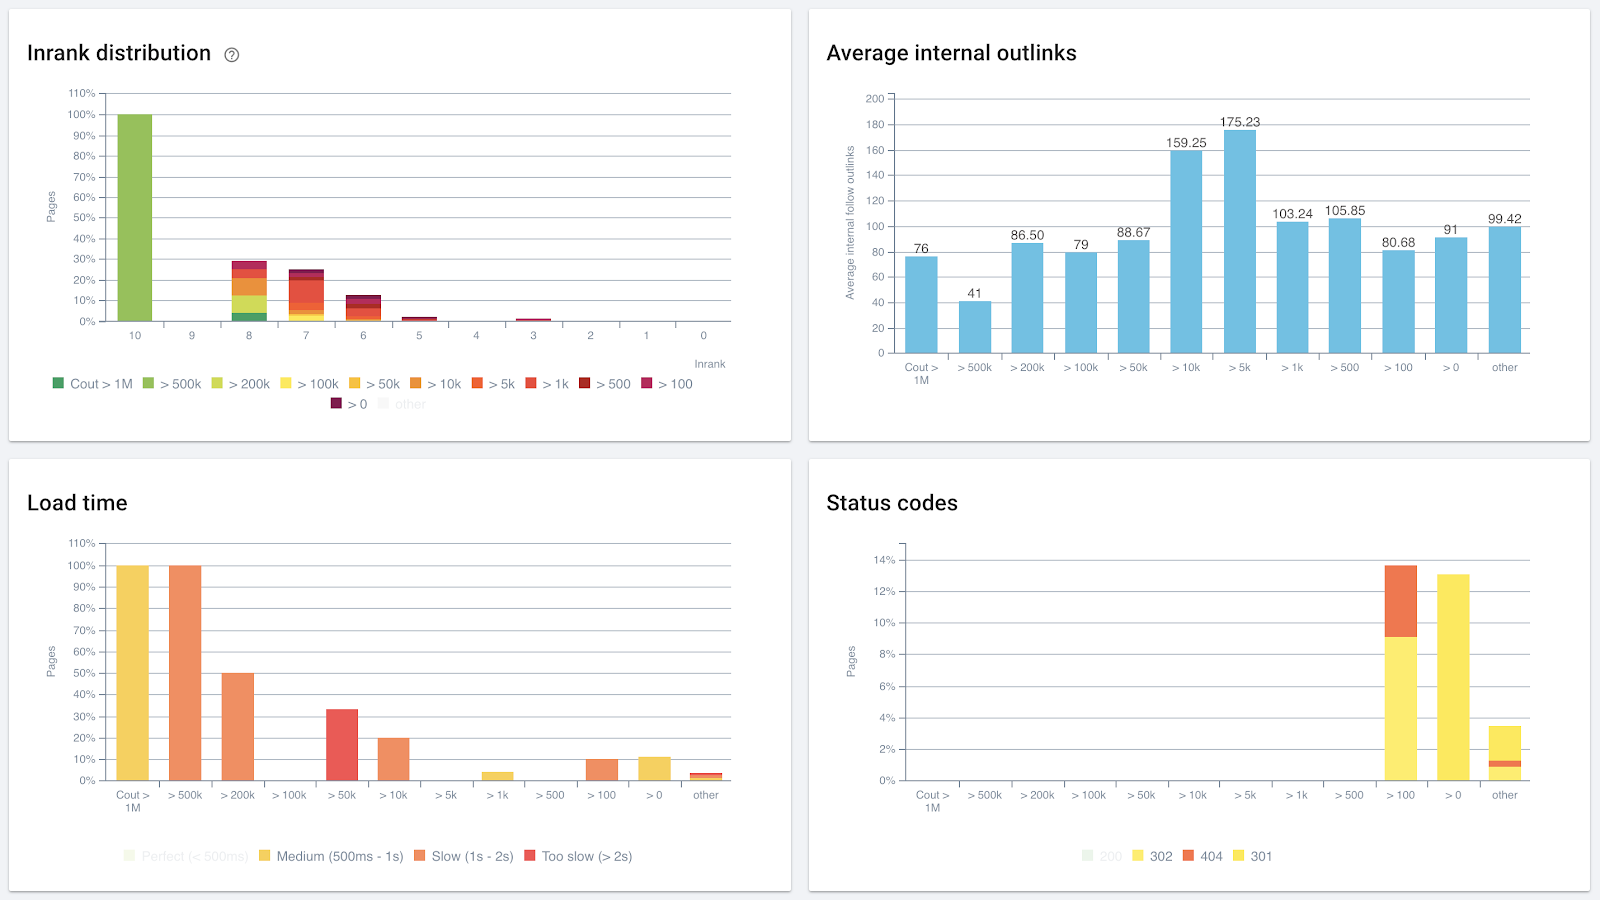
Part of a Quality Score factor check on pages with SEA spending.
Setting up GoogleAds data ingestion
To analyze GoogleAds data with your SEO data, you’ll need to add your SEA data in Oncrawl.
Begin by exporting your GoogleAds data as a CSV file. You will need to include the landing page URL, as well as the information you might want to track, such as:
- Keyword
- Impressions
- Clicks
- Click through rate (CTR)
- Cost
- Average CPC
- Average position
- Quality Score
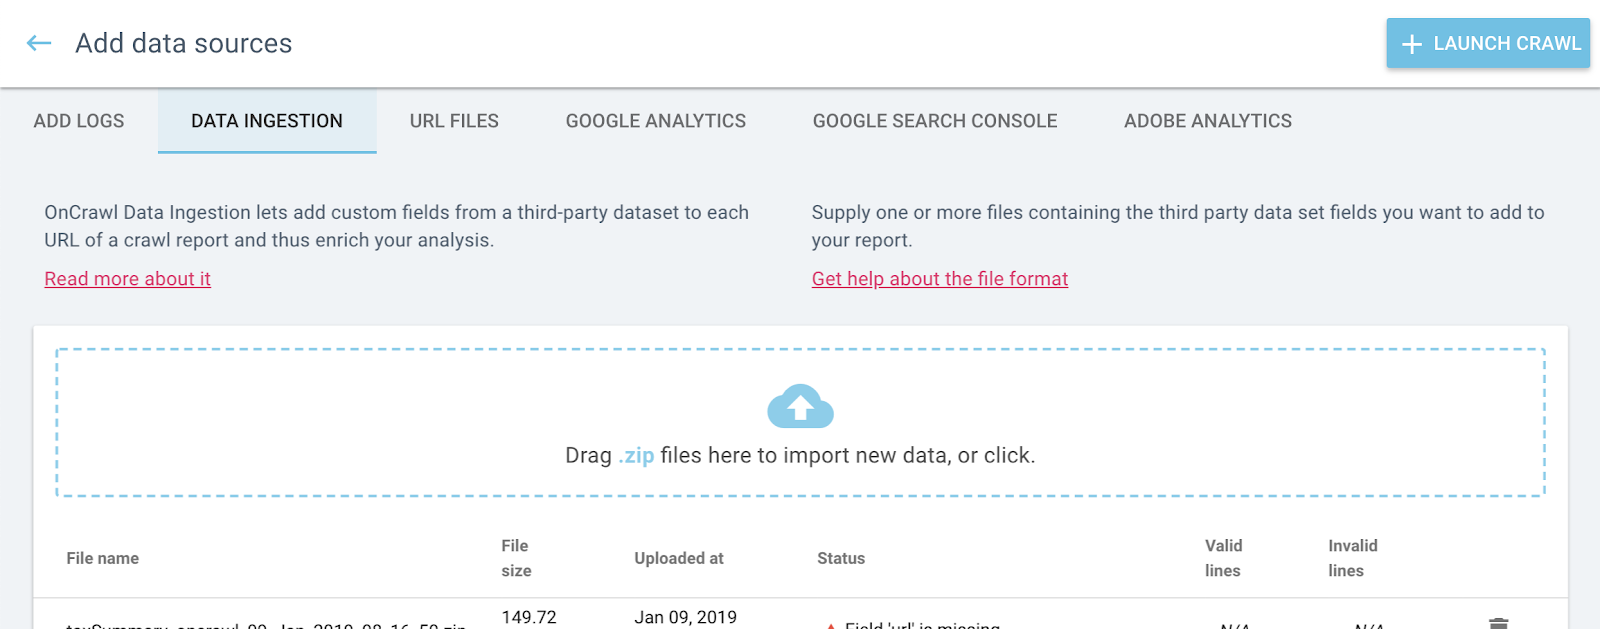
In Oncrawl, from your project page click on “Add data sources” and switch to the “Data ingestion” tab.
Drag and drop your CSV file onto the upload area within the dotted blue square.
Connect your Google Account
You will need access to your site’s Google Search Console data if you want to look at organic ranking information. (This is an option feature.)
To connect your Google Search Console account, return to “Add data sources” and switch to the “Google Search Console” tab.
Click on “Add Google Account” and follow the instructions. You’ll need to make sure that pop-ups are not blocked.

Running a crawl with GSC and Data Ingestion
Create a separate crawl profile for GoogleAds Ingestion:
1. Click “+ Set up a new crawl” from the project home page or “+ Launch crawl” from the Data sources page.
2. Click “+ Create crawl profile” and select your usual crawl profile as the profile you want to base the new one on.
3. Scroll down to the “Analysis” section to enable the Ranking Report using your Google Search Console data, and Data Ingestion using the CSV file you uploaded earlier.
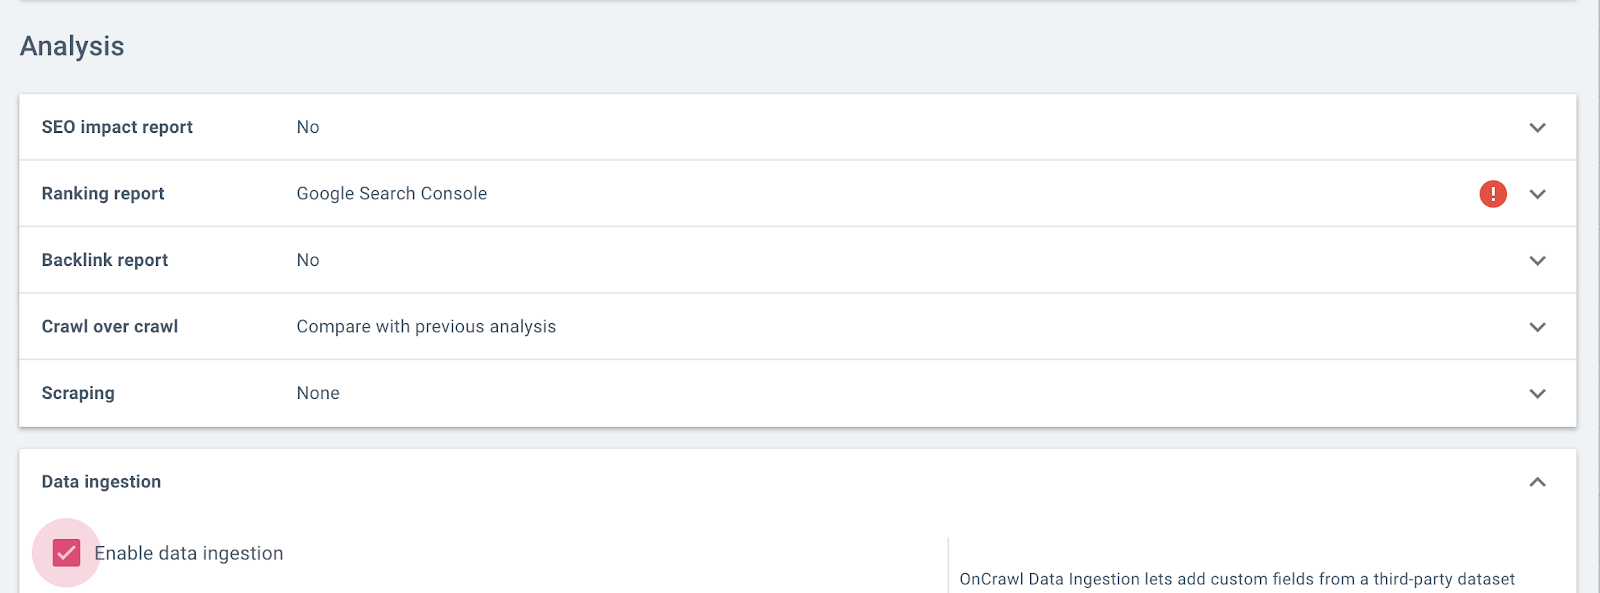
Launch a new crawl with this profile.
Setting up useful segmentations
When your crawl has finished, you will be able to use it to create new segmentations for SEA-SEO analysis.
Here are a few examples.
SEA cost and SEA click-through rate
Another useful type of segmentation will group URLs targeted by ads campaigns by investment values or by CTR:
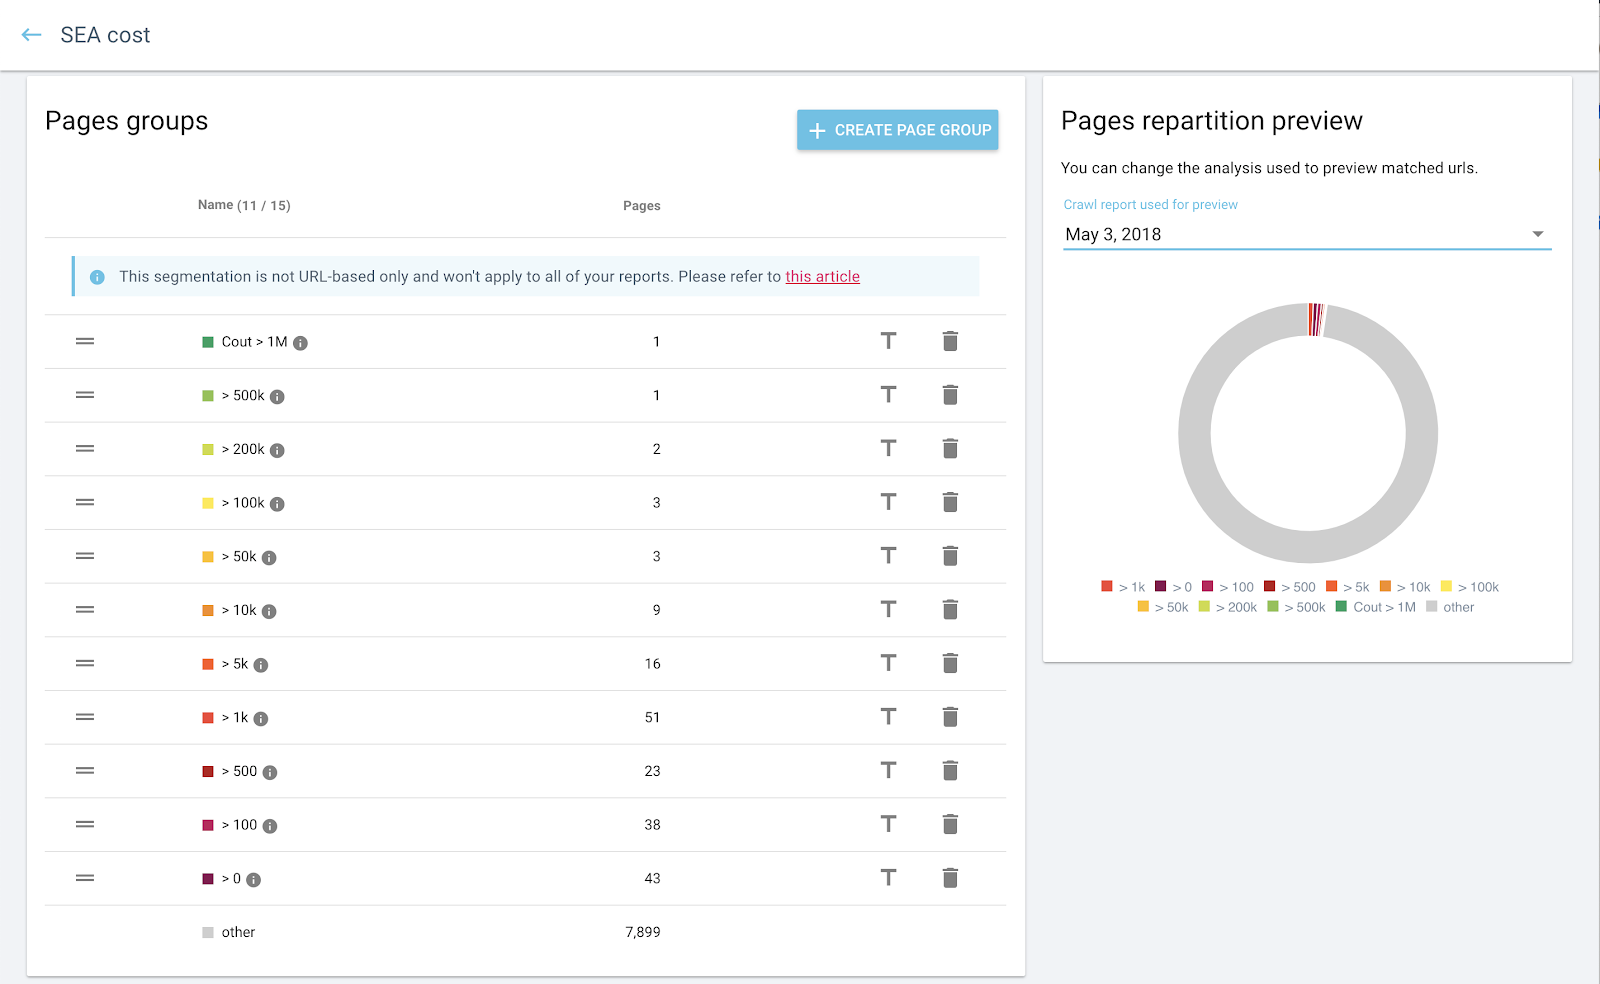
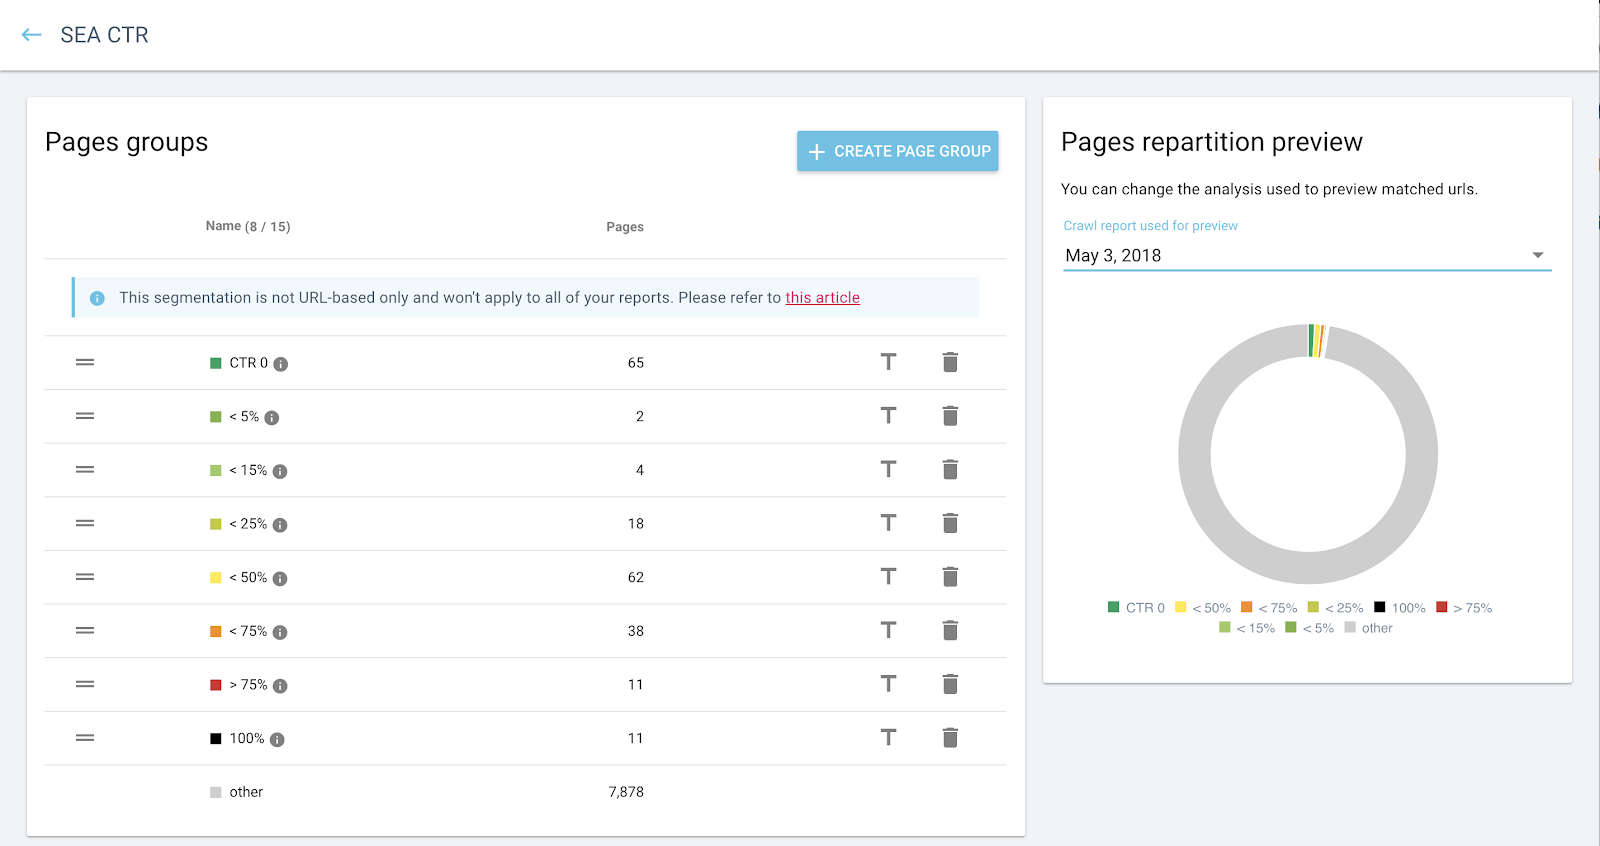
Define the bracket values based on appropriate ranges of CPC in your investment schema or range of CTRs.
SEA Quality Score buckets
Another segmentation we’ve found useful is to group URLs targeted by ads campaigns by their Quality Score.
Depending on the granularity you need, you can create buckets for each score, or group scores using the following pattern:
- Poor QS
Quality Score – Userdata – less than (<) – 7

- Average QS
Quality Score – Userdata – equals (=) – 7 - High QS
Quality Score – Userdata – greater than (>) – 7
Interpreting the crawl results
Optimizing SEA landing pages to improve your quality score
This analysis uses a SEA Quality Score segmentation, and filters for SEA landing URLs with a poor quality score.

Using this filter, check for systematic on-page issues, and in particular issues with the following elements:
- Indexability
- SEO HTML tags
- Duplicate content
- Payload
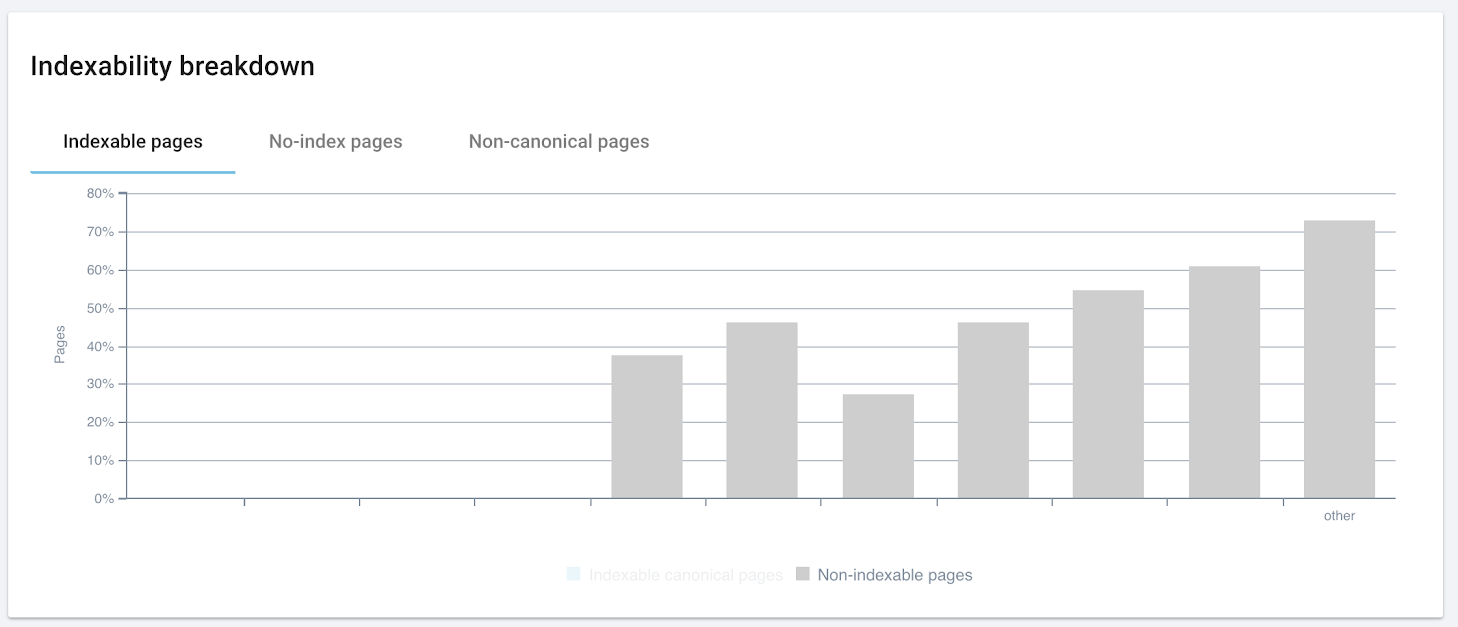
Unexpected: non-indexable pages used as landing pages in SEA campaigns.
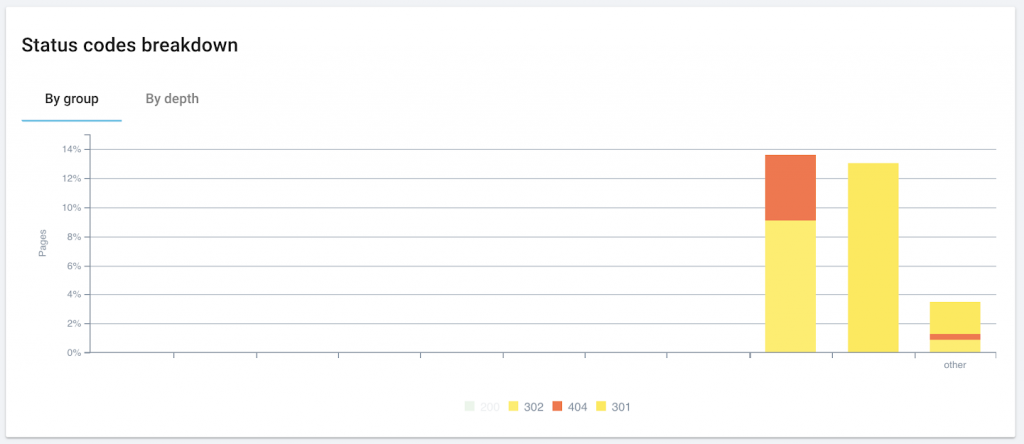
Pages with 3xx and 404 status used as landing pages in SEA campaigns.
Improving the quality of your page by correcting duplicate content, improving page speed and size, optimizing the title, header, and description, and checking indexability factors will contribute to a higher Quality Score.
Cross-comparison of rankings vs investments
Because SEA has a quick turnaround time (particularly compared to SEO, which can take months to yield results), it’s often recommended to use SEA to reinforce the performance of key pages that don’t yet rank well.
At the same time, pages that rank well organically have less need for large-scale SEA investments. However, studies have shown that pages that rank very well organically will earn the most visits if they also benefit from some SEA support.
The chart “Impressions, clicks and CTR” helps to compare organic impressions or CTR with SEA investments:
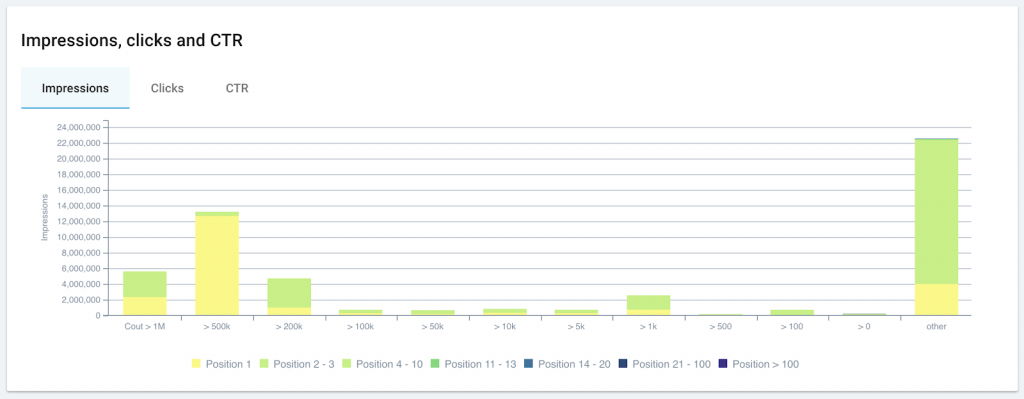
This website spends >500K on multiple pages in (organic) position 1 with a large number of SEO impressions. The SEA team may want to shift this budget to promote pages with fewer SEO impressions.
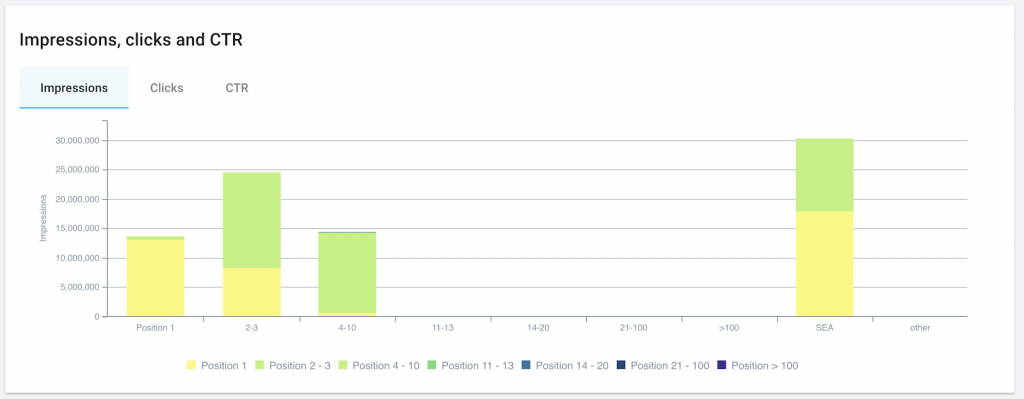
Using a breakdown by SEO positions or SEA campaigns, it’s clear that the bulk of impressions, even in the case of SEA campaigns, come from pages ranked organically in positions 1-3 (yellow and bright green).
The chart “SEO active pages” provides a visualization of pages with organic visits, ventilated–depending on the segmentation you use–by SEA cost:
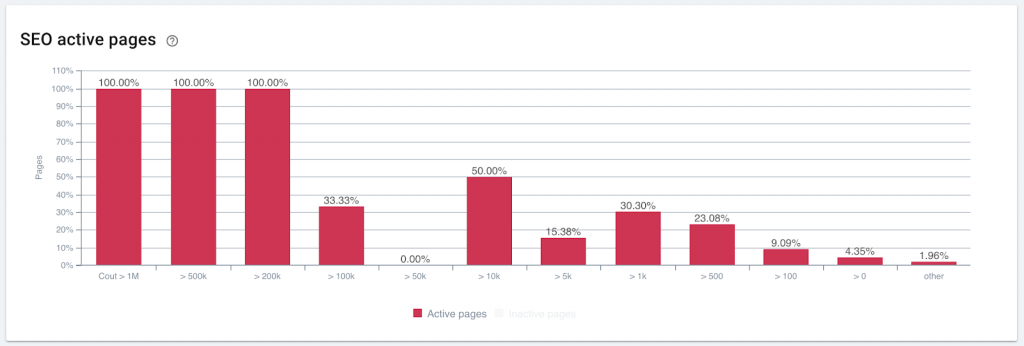
All of the pages in which >200K is invested have organic visits. These pages may not need the boost from high-investment SEA spending.
The same chart provides slightly different information when used with a segmentation to ventilate by SEA CTR:
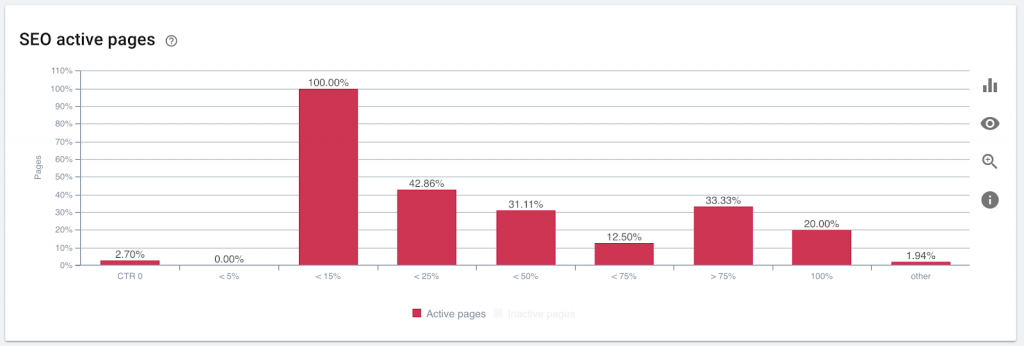
SEA campaigns with a low CTR and little to no organic activity (to the left) are worth a closer look: these pages aren’t attracting visitors. It’s also worth checking the amount spent on SEA campaigns with a relatively low CTR and a very high percent of active SEO pages: if spending is high, it can likely be shifted to other campaigns.
One-stop CTR tracking for SEO and SEA
Yes, you can see the distribution of click-through rates for SEO and SEA on the same page–and even on the same graph:
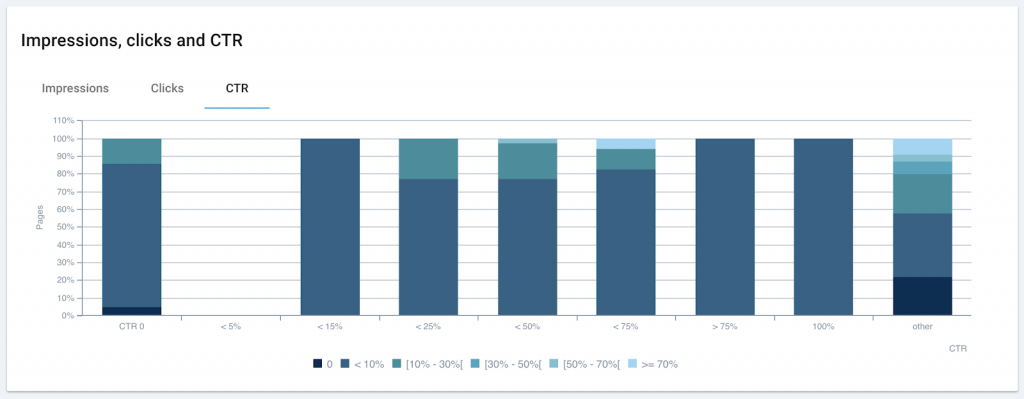
Each bar represents an SEA CTR bracket; each color shows the breakdown of that bracket by SEO CTR. Edge cases–where SEA CTR is low and SEO CTR is high, and vice versa–are often areas where adjustments can provide quick wins.
Examining your own SEA and SEO campaign strategies
You can apply these strategies to your own GoogleAds and other paid campaigns in order to view the interaction between SEO and paid marketing–and to spot areas where you may be over-investing in paid advertising.

