
Planning a PPC budget and knowing when to run specific Google Ad campaigns can be a difficult task. As marketers we know users don’t always behave the way in which we expect them to and dividing your marketing budget equally over the 12 months is not a solution. There are so many elements to consider: holidays, weather, special events are just some of the few things which impact marketing activity. Planning seasonally is crucial if you’re running PPC campaigns for clients, one thing clients don’t like is wasting unnecessary budget.
That’s why it’s always best to plan ahead when it comes to your client’s budget. One of the tools that we enjoy using when it comes to PPC planning is Google Trends! This awesome tool has an abundance of data for marketers to help plan and enhance PPC campaigns.
In this article I will share why I think Google Trends is a great tool when it comes to planning for PPC campaigns as well as why I use it for my ecommerce PPC clients when allocating campaign budget. I also love using it to get an understanding of popular trends amongst different categories that my e-commerce clients sell.
Why is it important to look at trends?
As many of you already know, seasonality is a huge factor when planning PPC campaigns, you will waste budget if you have campaigns running 360 days of the year. Although Google Trends won’t show you search volume for a specific keyword, it allows you to see the user interest of a specific keyword over time, allowing you to plan your PPC campaigns more effectively.
With more and more businesses advertising online and trends constantly changing, it’s important to stay ahead of the curve, when planned properly, seasonality can present an excellent opportunity for businesses to stay ahead of the competition and succeed.
[Case Study] Evolving SEO needs: from start-up to unicorn

Step 1 – Getting started with Google Trends
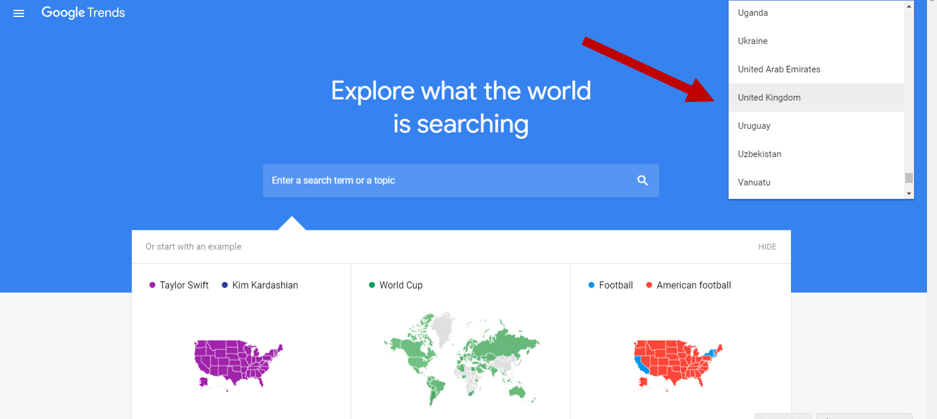
Let’s look at the different steps that are required to take full advantage of this tool. For the purpose of this article I will be giving you an example of an e-commerce business that sells all different types of women’s shoes, such as sandals, boots and wedding shoes. First things first, we want to decide on the country where we want to see user keyword interest. Go ahead and choose the country before you start your search:
Step 2 – Going more granular with your keywords
Don’t simply search at a top category level such as “women’s sandals” what’s great about this tool is that you can go more granular and search sub-categories of the main category. Let’s look at search interest for sub-categories of women’s sandals that this e-commerce business sells on their website, these include, high heel sandals, low heel sandals, wedge sandals, and flat sandals. The graph below provides a clear picture of the level of interest for each keyword in the past 12 months in the United Kingdom.
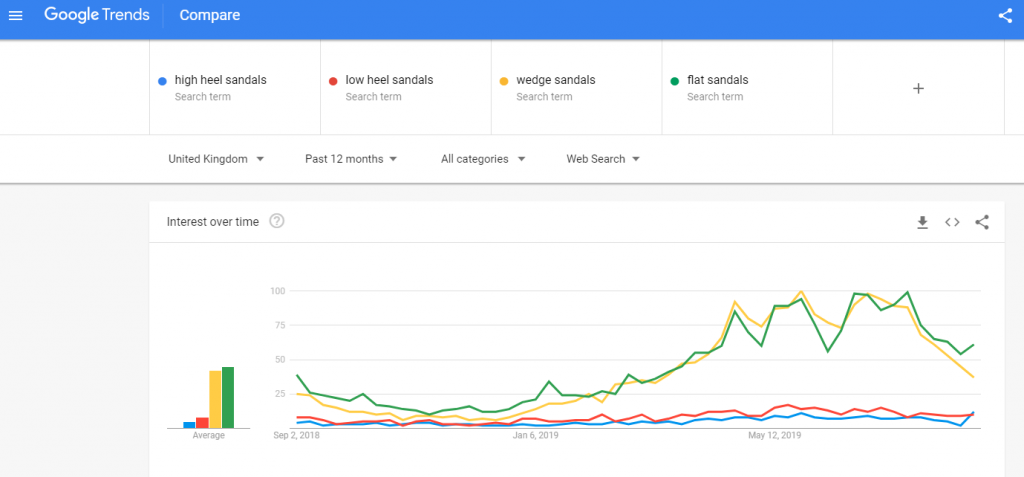
Search interest is based on value of 0-100 indicates that this is the peak popularity of the specific term, 0 indicates that there is not enough data for this term.
From the graph above we can clearly see that wedge sandals and flat sandals have a higher search interest from users compared to high heel sandals, and low heel sandals. The level of interest for the categories is also interesting to plan which campaigns might be considered “core” in your account versus secondary and tertiary campaigns. The core campaigns in this case would be wedge sandals and flat sandals.
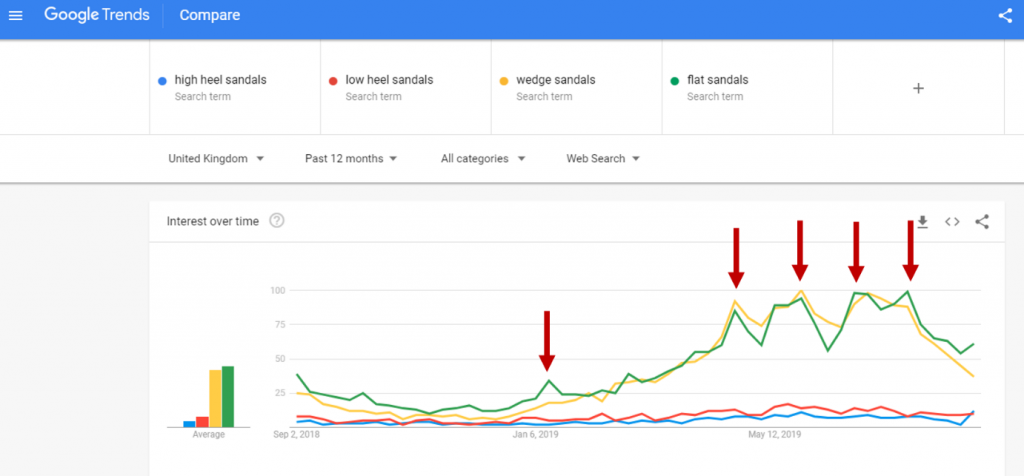
But what does this graph really tell us?
It tells us that we want to keep a big slice of the clients annual marketing budget from April to August and give less budget to high heel sandals and low heel sandals categories as these have a lower search interest compared to the others.
We should be running paid activity during the peaks as this is when users will most likely take action. When the peaks are lower you can also run other forms of “soft” digital marketing campaigns such as email and social.
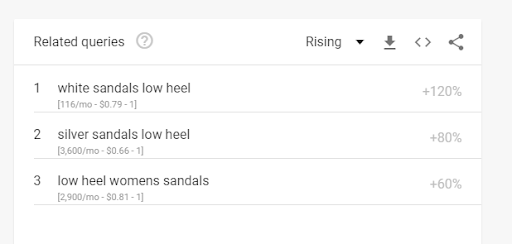
It’s also important to look at related queries as it gives you a deeper understanding of related terms that are popular among users. Take the category of “low heel sandals”, you’ll see that colour is an important variable in the related queries, such as “white” and “silver”. This information gives me the knowledge to perhaps create a separate campaign based on colour and create a specific landing page for “White Low Heel Sandals” to make the website more relevant to the users queries and therefore increase conversions on site.
Step 3 – Using the data to plan for PPC budget
Google Trends allows you to compare up to five keywords, we have chosen four of our “core” keywords – these are the ones that will drive most of the traffic to the site as well as driving sales.
Now let’s plan for allocating the PPC budget monthly. Just above the Google Trend graph, you can download the data into a .csv sheet which will look like this:
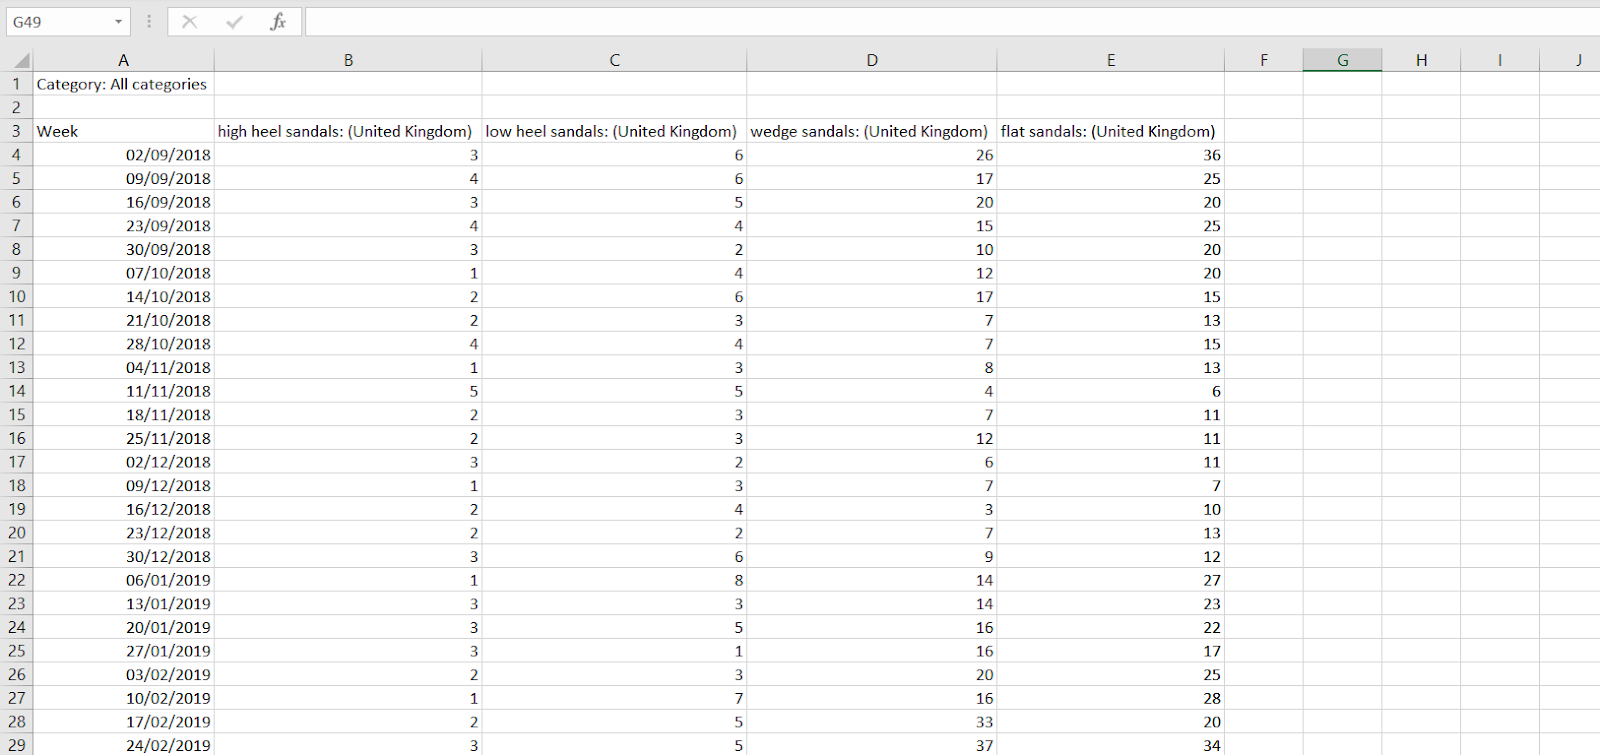
The table breaks down the value of interest (score from 0 – 100) per week for each keyword. We need to modify this table to plan our PPC budget per month rather than per week.
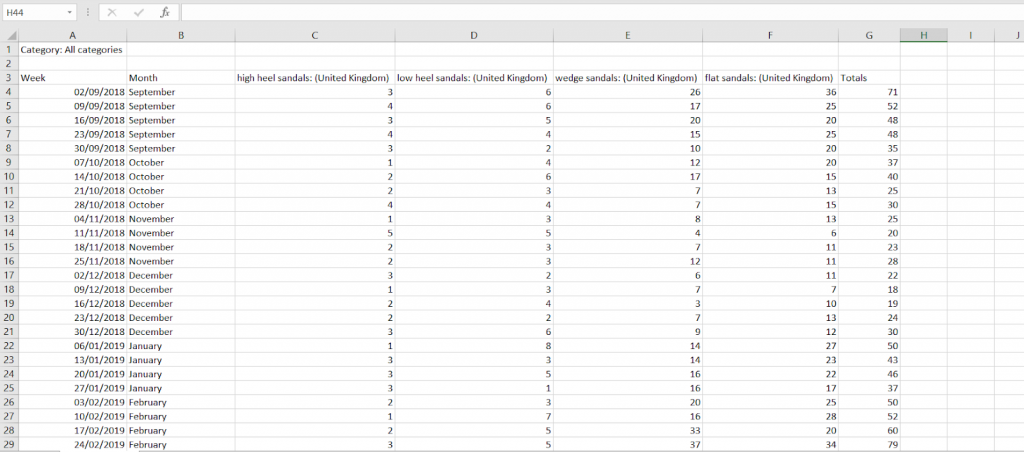
Since the sheet doesn’t include a column for “Month” we need to add one in next to “Column A”. We also need to add up the totals of search interest across each keyword. The “Totals” column will be added next to “Column F”. Now your sheet should look something like this:
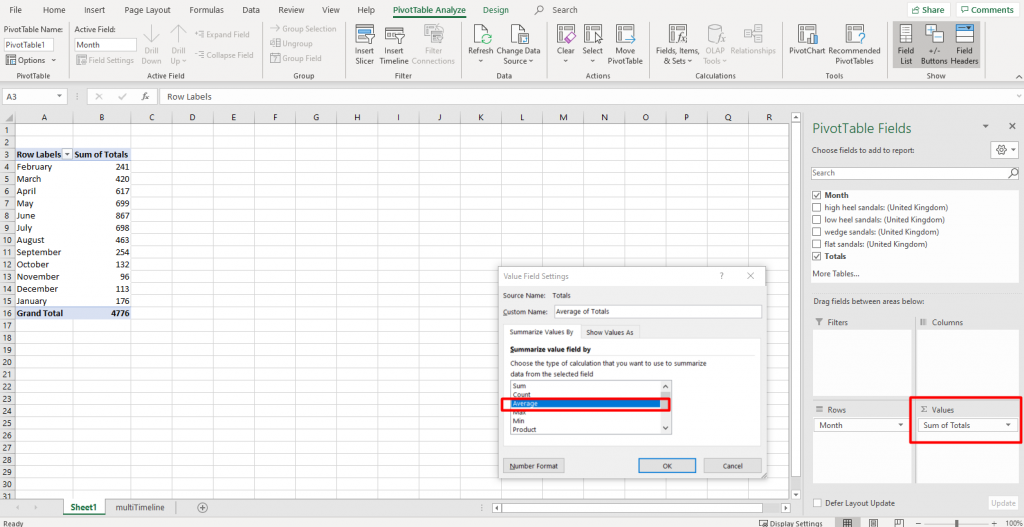
Next, we need to create a pivot table to highlight the totals for each month. However, make sure to change the value field settings to “Average” rather than “Sum of Totals” since some of the months in the table have four weeks of data while others have five weeks, and this might skew the data.
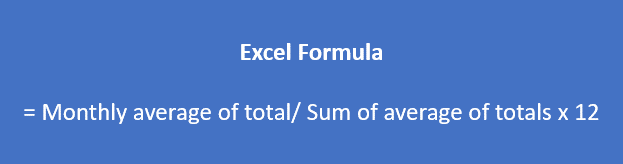
Now that we have our pivot table, we need to copy and paste the values from the table to another field and turn the level of interest into an index. Use this formula below to turn the “Average of Totals” to an “Index” by adding a column next to “Column F”:
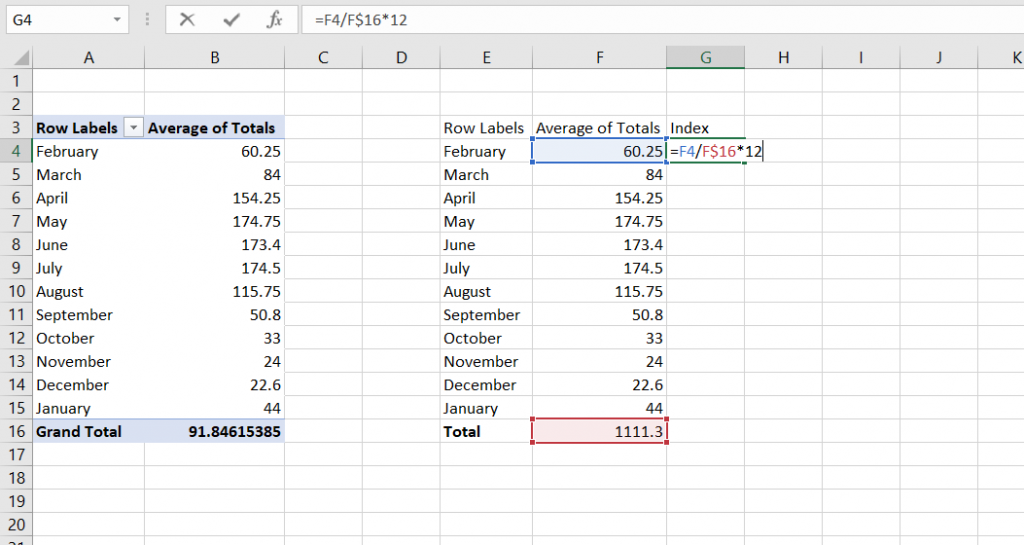
After creating the index of the values, we can now apply the monthly budget across the 12 months. Create a “Monthly Budget” column next to “Index” and add the total annual PPC budget in the “Total” row. Use the formula below to calculate the monthly budget for each month:

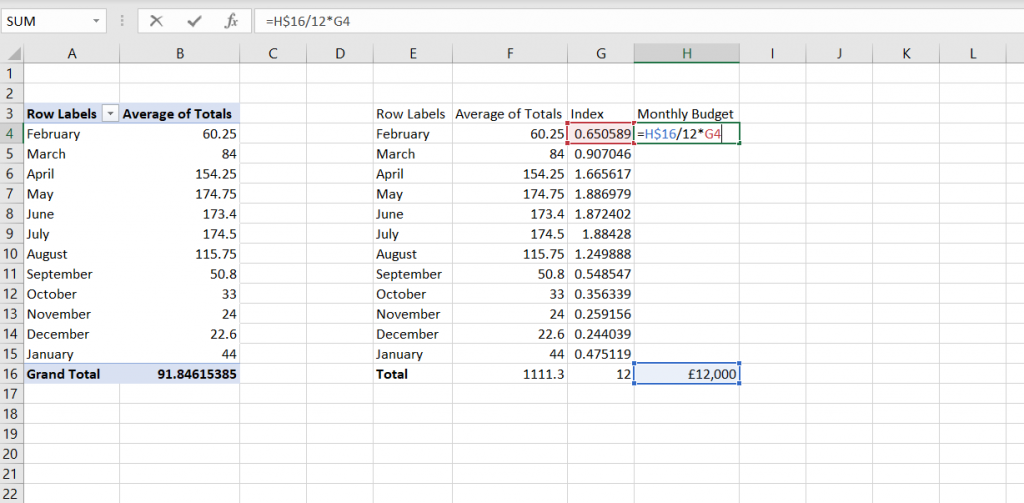
Your finished table should look like this, with the PPC budget attributed for each month using the data that Google Trends has provided for us:
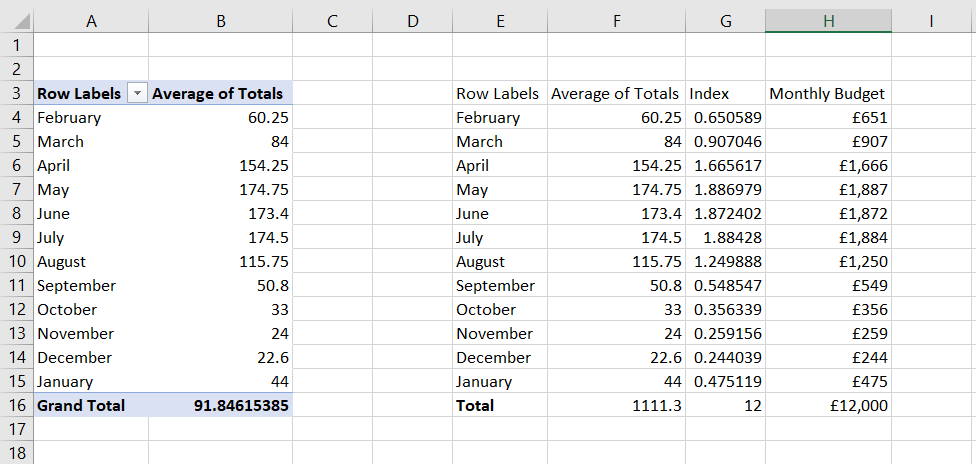
Now that you know how much monthly budget you want to allocate, you can refer back to Google Trends to get an understanding of how much you want to spend on each women’s sandals category.
Final Remarks
Google Trends is an incredibly powerful tool that PPC managers should take advantage of more often. It will give you that extra leg up when it comes to marketing planning, since we live in a user-centric world it allows us to put the user first when it comes to planning since we are able to see the level of user interest for each keyword. Trends are constantly changing so make sure you are ready to recalculate and redistribute budgets whenever this occurs.