When researching a complex topic, we all want to find something that briefly explains what we are trying to understand. And that is why, when creating content for different websites, we must strive to present concise information that is easy to understand.
Hence, infographics are an ideal tool to express a number of topics and increase the chances of ranking with SEO.
You may be asking yourself why they are so important? What are infographics, and why do they help your SEO? Don’t worry; next, we will reveal everything you need to know, so don’t skip a line to learn how to use these graphics on your website.
And don’t hesitate to put our suggestions into practice! Infographics are not challenging to do; you just need the right tools to provide the value your audience deserves.
The importance of image search
Every day, more and more well-selected, visual media is being indexed on Google. It allows users to visually explore new information and as such is becoming essential if you want to reach your targeted audiences. Graphic content has much more power than it used to; currently, almost 30% of the results returned by the largest search engine of all (Google) are images.
And, if you think about it, images on blogs, web pages, or on different e-commerce sites offer incomparable added value because they create a better user experience and properly optimized images will help you rank better.
Additionally, images are essential in structuring different types of web pages. Finding the correct visual representation makes it easy to divide the text, differentiate one topic from another, and facilitate the user’s understanding of your content.
So if you can accomplish all that with a simple image, imagine what you can do with infographics that explain complicated processes or topics. Of course, other factors are involved besides the image’s quality, such as their SEO optimization.
All this helps search engines to rank publications positively, thus improving the indexing and positioning of the keywords you use.
[Ebook] Using projections to reinforce an SEO strategy
What are infographics?
Infographics are images edited with various components whose purpose is to display all kinds of data using multiple visual media.
In a few words, they are a mixture of illustrations with text that presents organized data to explain a specific topic. There is information that is not easy to present since it is made up of a lot of data; hence, infographics allow it to be broken down.
This means that they are a valuable resource that renders even the most complicated concepts easier to grasp, thus giving readers an engaging, visual representation that’s easy to understand and to share.
Infographics can be used to display timelines, step-by-step procedures, and many other kinds of information. They are also a versatile tool for your content marketing plan. The visual representation of information helps users comprehend and retain messages more readily. This is not surprising since most people find it easier to remember images than text.
Types of infographics
Infographics have several characteristics that make them a resource that can help answer many questions. There are different types of infographics, depending on their purpose:
- About products: They highlight salient features of a product or service, have large images, are readily appreciated, and are intuitive.
- Scientific: These divide concepts into blocks, integrate numbers highlighting specific data, and include icons. They also contain sources.
- Geographical: Such infographics are made of different colors, maps and indicate certain places using arrows and other icons.
- Biographical: They give information about a person’s life to denote their history, studies, origin, facts, and others. They incorporate timelines and images of the person involved.
- Processes: These infographics reveal visual schemes. They are usually prepared with well-defined diagrams and include images on the subject.
- Statistics: They are ideal for displaying figures, such as monthly balances, and research on topics loaded with statistics, percentages, and others.
- Journalistic: Based on real stories or court cases in progress. They narrate facts with chronological data and provide sources that detail the events and facts.
- Comparative: They are widely used for products, people, places, and companies since they allow us to identify the advantages, differences, and similarities and show precise data on a specific issue.
- Hierarchical: These are great if you want to expose a procedure that has to be carried out thoroughly. They also serve in organizational charts.
How can infographics help your SEO?
When we want to convey somewhat complicated or unexciting information to our audience, we go out of our way to prepare something exciting and illustrated. That is why we use examples, comparisons, and audiovisual media to better help people analyze what is shown.
Infographics are the perfect strategy to catch people’s attention and motivate them to continue reviewing the information. With them, we manage to turn a confusing subject into an entertaining and even simple one to grasp.
Plus, you can also add links to your website in your infographic, which will ultimately help your SEO. And that’s not all; they also provide additional advantages that we’ll examine in detail below.
They drive traffic to your website
Infographics can increase site visits and can have an impact on engagement and dissemination on social media. In fact, people often launch search queries with, “Infographics about…” so browsers will display the images directly.
Web pages with infographics allow the reader to understand the data or information being shared, faster. Consequently, many webmasters and content creators see this as a helpful tool for informing or explaining what they need to.
The truth is that most Internet users don’t want to spend a lot of time reading an article; instead, they want to be able to quickly scan a page, decide if the information is useful and either continue to examine the information presented or move on to find something that better answers their query. As a result, Google continues to update its algorithms with the goal of better serving users and today it indexes visual content such as images, graphics, or photographs, not only text.
Therefore, beyond the aesthetically pleasing element images offer, well-prepared graphics are an instrument that helps improve search engine results rankings.
In other words, you increase the chances of getting clicks by creating an infographic with concise text, explanatory icons, and an intuitive sequence. One well constructed infographic can incite someone to visit your website if they are interested in your content.
They are easy to share
Consider how many memes and images are being sent at this moment through apps like WhatsApp, Telegram, or other social media channels. In fact, if you add your watermark or logo to the infographic, you can improve your reach. For Instagram alone, it’s been shown that infographics can boost engagement rate and brand awareness.
Remember that, when browsing, our eyes are immediately drawn to what attracts us, and it is scientifically proven that images have a stronger impact and attract more attention than text alone.
Also, if at any point you want to summarize something quickly or don’t want to spend too much time clarifying a particular topic, sharing an infographic makes it happen in less time.
They help build links
Link building is a strategy that encourages other websites to link to yours without paying them. Sure, this takes effort and a lot of planning, but with infographics, you can also do link building and guest blogging. For this to work correctly, all parties involved must be of quality.
If the infographic becomes viral, your website will obtain more visits in a short period of time. Why? Because if we add an embedded code, when another person copies and pastes our image on their website, it will automatically generate a link. This means that it is an ideal method for our positioning strategy.
[Ebook] Data SEO: The Next Big Adventure
They are attractive
It is very likely that an infographic caught your eye in the past, or perhaps even today.
Infographics are a comfortable formula to transmit anything graphically since it allows you to do it in a condensed and aesthetically pleasing way. The ultimate goal is to summarize data, provide a lot of value and impact the user.
Thanks to their persuasive appearance, those who see them easily remember the information and often remember the web page where they found the image. In turn, they will hopefully share the infographic and this process can help to increase visits.
Of course, to make all this a reality, you must add details and a design that stands out from other infographics. This requires that you use the right design tools.
How to optimize infographics for better SEO results
The primary goal of SEO is to increase your visibility and drive organic traffic to your site. It’s hard to estimate by how much infographics can increase engagement and retention time, but we do know that, “the human brain can process entire images that the eye sees for as little as 13 milliseconds”. It stands to reason then, that an image will have more of a lasting impact than just a block of text. Therefore, basing an SEO strategy on infographics increases the chances that the site will get more reach in the SERPs.
Of course, it is essential to improve them in such a way that their growth is organic. Consequently, applying the following suggestions can prove very useful.
Use the right keywords
Searching for the right keywords is essential in SEO; without them, it is impossible to fulfill its purpose. This is a safe way if we want the exposed content to match what most people are looking for.
In that case, finding a keyword that stands out in the infographic is vital to respond to users’ search intent. By doing so, the image will then get a place on the search engine’s results page.
It is then essential to select a keyword that is likely to stand out from the more general ones. For example, writing “computers” is not the same as writing “brand X computers”; the choice of words must be intentional and specific.
Therefore, before creating the infographic, take some time to identify the keyword that will make your content more useful and provide added value for the readers.
Create riveting and well-researched supporting content
No matter how attractive the infographic, if it doesn’t include interesting content or data that adds value to the reader, it will not help SEO efforts or convey the intended message. Therefore, it must have a reliable origin. Without credible source material, your brand runs the risk of being perceived as not reliable. Selecting your data well is essential.
After having read and compiled solid and valuable content, start to separate it and inspect what best explains a specific topic.
Once you have identified the information you wish to share, then decide how to arrange the information in a graphic format that is visually pleasing and easy to understand. Keep in mind that your goal is to share the data in an easy to understand manner, not necessarily to summarize the information.
Optimize images
As we discussed before, images are great for engagement; however, optimizing them for SEO is essential before you can achieve positive results.
This means it is necessary to publish images that comply with the good practices that Google has shared. To that end, the browser will consider them for indexing when they are crawled. In order to optimize for SEO, you should consider following these steps:
- Select a name that incorporates the main keyword. Don’t use multiple words and avoid adding special characters.
- Make sure to include alternative text for all the infographics you publish. With this HTML tag, you get W3C validation so the system can easily track the information. That is why it is appropriate to use the keywords.
- Optimize the size of the image and its title since Google uses the size information to provide the best results.
- Add rich snippets to increase the CTR of your website, such as stars to rate the content, advertising, or invitations to events.
- Do not overlook the p.xml system in images, be specific in the title, in the URL of the file, and in the base of the image. Also include its geolocation.
- Prevent your robots.txt from blocking your content from Google spiders.
- Add external links to your infographic so that their popularity grows. This being the case, avoid unreliable links and keep an eye on other details. You will probably get more shares than you think.
- Compress images and adapt them for all types of devices. Use JPG and PNG formats. And in case you want animations, use GIFs. It is also possible to use .svg.
Add a call to action
The call to action (CTA) is the phrase or word that invites your reader to do something after providing them with the knowledge they need. With a persuasive message, you can presumably convince them to carry out your proposed action. Try to understand your user’s search intent and provide an answer or solution to their needs with your proposed action.
Make them easy to share
If you provide an infographic with valuable content, that is easy to understand, and that provides excellent images, it’s no surprise that viewers will want to make it part of their library. Therefore, don’t make it difficult for them to download these images; instead, make them easy to save or send.
Once the user has it on their device, it will be easy for them to send it to their work group, family member, friend or to share on social media. Bonus, if you have already placed your logo or indicator that leads the reader to visit your digital space, your reach will grow.
Include an embed code
By embedding a code in your infographic, it will be easier to track your reach and engagement. Those who want to add the image to their website can do so, but at the same time, they are making an exchange with you. Why? Because such a code immediately links to where it came from.
In order to generate the embed code, one option that is available is the tool by Siege Media. Here, you can enter the name of the page you want the user to visit, which must be included as a message so that the person remembers to give you credit or link to your website.
Now, it’s time to make the URL public: the URL should be of the infographic you’re uploading.
To conclude, adjust its dimensions and insert an alternative text tag without discarding the word “infographic about…”. Finally, copy and paste the generated code into the HTML of your website, preferably underneath your infographic, as this motivates the viewer to embed the image elsewhere.
Technical elements that help make infographics easy to search
If you already know what you are going to talk about and if you have already identified the words that have to stand out in your infographic, weighing the SEO factors, great! It is time for you to focus on the technical elements that must be integrated for them to be easily found.
Give it a simple, short, attractive, and persuasive title; this allows the image to reach more people. Make it something catchy that will intrigue users and incite them to want to find out more. It only takes a matter of seconds to capture or lose the attention of internet users.
Try to use pleasant language without very elaborate words that can be understood at first glance.
Check that the infographic is engaging, so the data will remain top of mind for those who are analyzing the information. In the same way, combine those images with a threaded narrative, which is in harmony with the entire context.
Finally, do not overlook placing the alternative text and embedding the code, as we mentioned before.
Examples of infographics that have been ranked in the SERPs
Like you, many content creators have noticed how versatile and effective infographics convey powerful messages and information. Therefore, this resource has been widely used for many years because it strengthens websites, blogs, and many accounts on social media.
Thus, many infographics have been positioned in the SERPs since they contain interesting, valuable data and are distributed in a way that has captured users’ attention.
Some of these examples include:
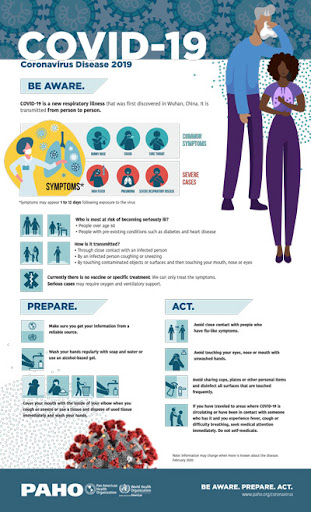
- This PAHO infographic on preventive measures for Covid-19 is excellent because it adds value and is concise:
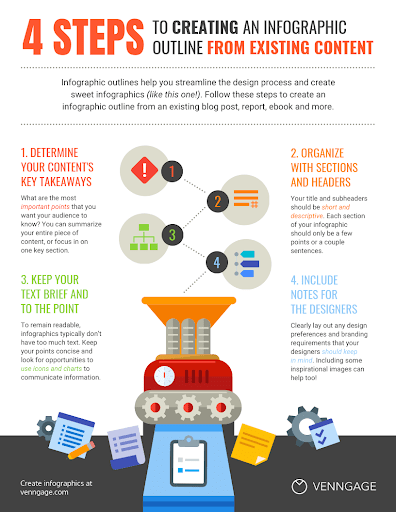
- An infographic on how to make an infographic by Venngage reflects concepts and gives a four-step guide on making one from existing content.

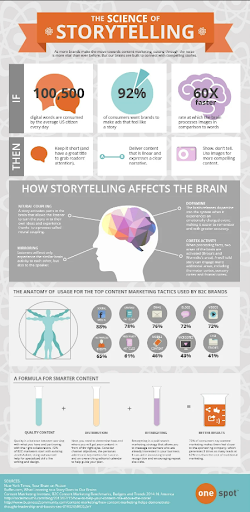
- A very complete and precise infographic by One Spot about how storytelling affects the brain.

Conclusion
If you have come this far, it is because you are interested in improving your SEO by reinforcing it with infographics.
Therefore, do not hesitate to put to use what we’ve just covered. Start learning how to make an infographic for free and test your design skills; that way, you will see that it is not complicated, but relatively intuitive.
It’s just a matter of having good taste, knowing what data you want to provide your reader, and finding the images and icons that support your explanation.


