
Log file analysis helps you understand how search engines are crawling a website and their impact on SEO. These insights are great to help you improve your crawlability and SEO performance.
With these data, you can analyze crawl behavior and determine some interesting metrics like:
- Is your crawl budget spent efficiently?
- What accessibility errors were met during crawl?
- Where are the areas of crawl deficiency?
- What are my most active pages?
- Which pages Google does not know?
The great thing is that you can also do it for free. Oncrawl offers an open source log analyzer.
It will help you spot:
- Unique pages crawled by Google
- Crawl frequency by group of pages
- Active and inactive pages
- and monitor status codes
How does it work?
1- Install Docker
Install Docker Tool Box.
Choose Docker Quickstart terminal to start.
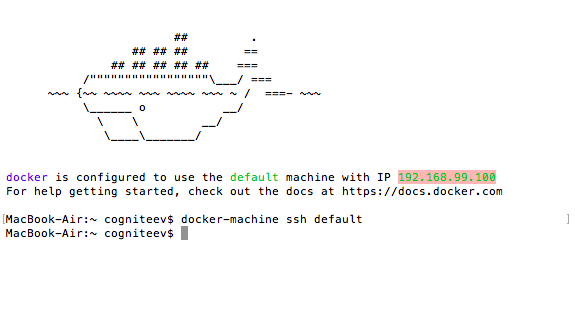
Copy/paste the IP address 192.168.99.100
Then, download oncrawl-elk release: https://github.com/cogniteev/oncrawl-elk/archive/1.1.zip
Add these lines in the terminal to create a directory and unzip the file:
- MacBook-Air:~ cogniteev$ mkdir oncrawl-elk
- MacBook-Air:~ cogniteev$ cd oncrawl-elk/
- MacBook-Air:oncrawl-elk cogniteev$ unzip ~/Downloads/oncrawl-elk-1.1.zip
And then, add:
- MacBook-Air:oncrawl-elk cogniteev$ cd oncrawl-elk-1.1/
- MacBook-Air:oncrawl-elk-1.1 cogniteev$ docker-compose -f docker-compose.yml up -d
Docker-compose will download all necessary images from docker hub, this may take a few minutes. Once the docker container has started, you can enter the following address in your browser: http://DOCKER-IP:9000. Make sure to replace DOCKER-IP with the IP you copied earlier.
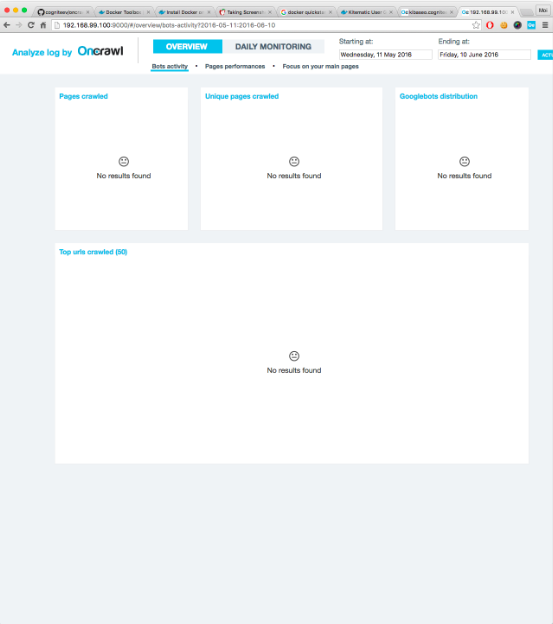
You should see the Oncrawl-ELK dashboard, but there are no data yet. Let’s get some data to analyze.
2-Import log files
Importing data is as easy as copying log access files to the right folder. Logstash start indexing any file found at logs/apache/*.log , logs/nginx/*.log , automatically.
If your web server is powered by Apache or NGinx, make sure the format is combined for log format. They should look like:
127.0.0.1 — — [28/Aug/2015:06:45:41 +0200] “GET /apache_pb.gif HTTP/1.0” 200 2326 “http://www.example.com/start.html” “Mozilla/5.0 (compatible; Googlebot/2.1; +http://www.google.com/bot.html)”
Drop your .log files into the logs/apache or logs/nginx directory accordingly.
3-Play
Go back to http://DOCKER-IP:9000. You should have figures and graphs, congrats !
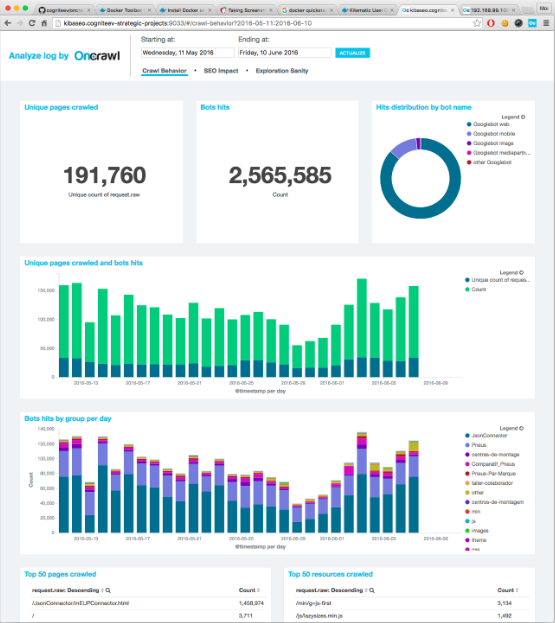
You can also combine those data with crawl data and access a complete view of your SEO performance. You will be able to detect active orphan pages, check crawl ratio by depth or page groups and many more interesting information. To know more about combined analysis, you can check this page.