What’s the first thing you do when you open a technical SEO solution? How do you approach data on SEO performance? Where are the quick wins? How do you know which metrics matter when analyzing your site?
At Oncrawl, we have found that this is often where our users get stuck. This is why our Customer Success Managers will sometimes work with a specific site to create a dedicated site report. This report draws the site managers’ attention to the Oncrawl metrics that reveal potential for improvement.
This information allows the website management team to optimize their SEO efficiency if they’re implementing improvements in-house. It also allows them to judge whether they need to call on an agency or consultant to perform a full site audit and to resolve the issues that are revealed.
Below, we’ll show you some of the classic strategies our Customer Success Managers use to determine the key metrics to follow for a given site from among all of the data available in Oncrawl.

What data to look at, and how to look at it
Get the full picture
Start by running a crawl that covers all of your site. You might need to ask yourself questions like:
- Are my crawl limits (max depth and max number of URLs) broad enough to catch all of my pages?
- Do I need to crawl subdomains?
- What are the additional sources of data that could be valuable in a full technical analysis of my site?
You’ll want to import or connect any third-party sources, and of course, it’s extra helpful if you can get your hands on server log data.
Zero in on what stands out
Next, take a look at the results. In most cases, it doesn’t help to fixate on the numbers. Start by looking at trends and percentages.
If you’re used to looking at website audits, certain things will stand out in crawl results and cross-data analysis. Often, though, you don’t need experience to spot these:
- Outliers and unexpected results: page groups or page types that out- or under-perform with regard to the rest of the site
- Excessive site depth
- HTML and site quality errors
- Unoptimized internal linking structures
- Duplication issues
- Issues with redirections
- Drops in crawl behavior
Use meaningful buckets to break down data
Your view of any set of data will change based on how you group the data points. When you have a website with different types of pages–or just a website with many pages–it’s no longer viable to look at every data point individually. This is where segmentation of your data into page groups comes into play.
Using segmentations to find the right view of the data will help make it easier to see your site’s characteristics and weaknesses. You should to consider:
- Modifying Oncrawl’s default segmentation to reflect the actual groups of pages of your website
- Creating new segmentations based on parts of the URL or on Data from Google Search Console, Analytics data, or log data

Here are some of Oncrawl’s best site segmentations to help you get started.
What your results might look like
When creating your own report for your site, make it easy to move between your report and the data. We like to include an chart, an explanation of the issue we found, and a link to the graphic or the Data Explorer for the list of affected pages so that we can find the information and search for more details later.
Outliers and unexpected results
This might cover anything from unexpectedly high proportions (over 3 out of 4 pages requiring more than 500ms to load or 1 orphan per 5 known pages):


to frequent 4xx and 5xx errors served to bots:

to unexpected correlations, like this one that shows pages with a higher wordcount (which might coincidentally be the pages for topics you have more expertise on, or pages you’ve worked harder to optimize) get crawled a lot more often than other pages on the site:

Excessive site depth
This crawl was stopped at a depth of 50 before it found all of the pages in the site:

Groups with more than their share of errors
Sometimes a particular group of pages has more errors than others.
In this case, nearly all pages in one of the site’s languages were found to be unindexable.

In another case, some of the site sections had more problems with their canonical strategy than others:

Managing duplicate content
If your site has groups of hundreds (or more) of nearly identical pages, make sure there’s a coherent canonical strategy in place:

Internal linking
Oncrawl’s Inrank measures the relative importance of pages within a site. It can reveal issues with internal linking structure.
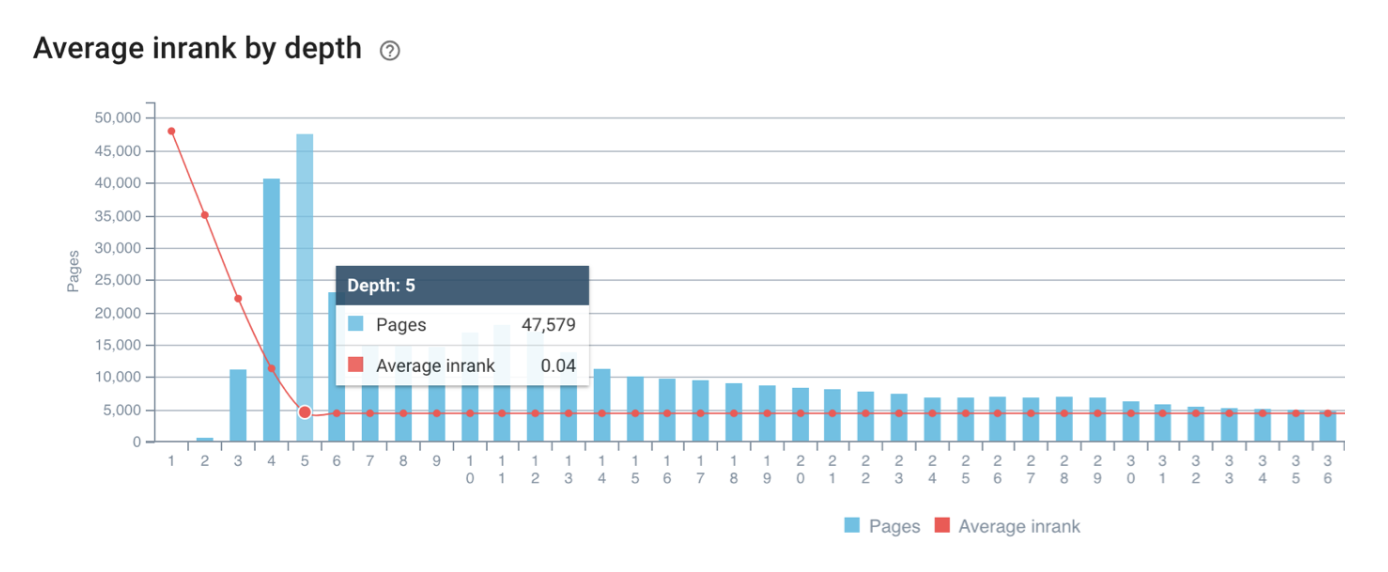
Massive headers, footers, and links within pages can dilute the importance of internal links. At worst, pages beyond just a handful of clicks from the home page no longer receive a quantifiable benefit from internal links. A warning sign is the sharp slope and then the flatlining of the red line that represents the average Inrank for each depth:

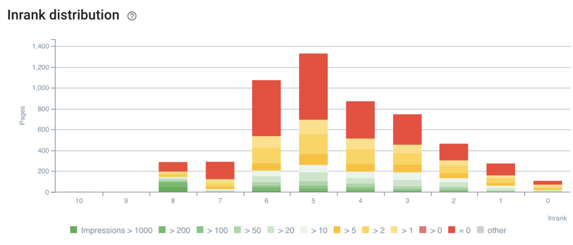
Segmentations can also reveal issues by providing the right lens through which to view the data. This site’s Inrank looked fine at first. But the number of pages earning impressions peaks at an Inrank of 5, which suggests that this site might profit from a new internal linking structure to better promote these pages:

Unexpected crawl behavior
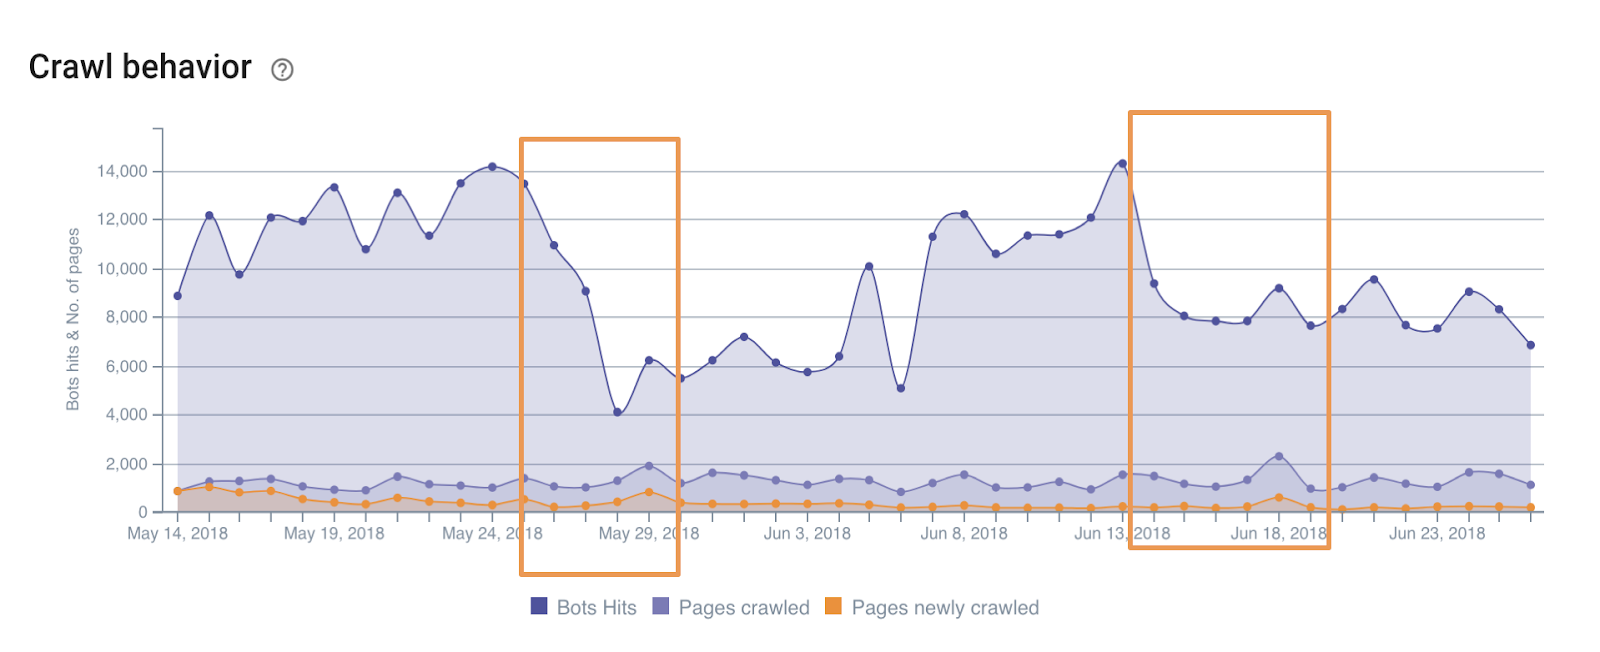
Correlating unexpected crawl behavior to site events can reveal how Google expects a site to behave, and to predict drops in ranking or in impressions. The periods highlighted below each occured about a week before ranking drops seen in Google Search Console:

What to do next
Once you know where your site’s weaknesses lie, it’s time to improve.
You also now know where the dangers lie for your site–and what to monitor to make sure you stay on track. It’s a good idea to regularly analyze your site and keep an eye on changes in the metrics you’ve targeted.
Oncrawl’s here for you, whether this is your first site check or your ten thousandth. And if you’re stuck, our support is run by our Customer Success Managers–experienced SEOs whose goal is your success.

