Know what's happening. Prove what's working.
Connect technical SEO data to search performance


Turn SEO data into decisions
your team can act on and defend
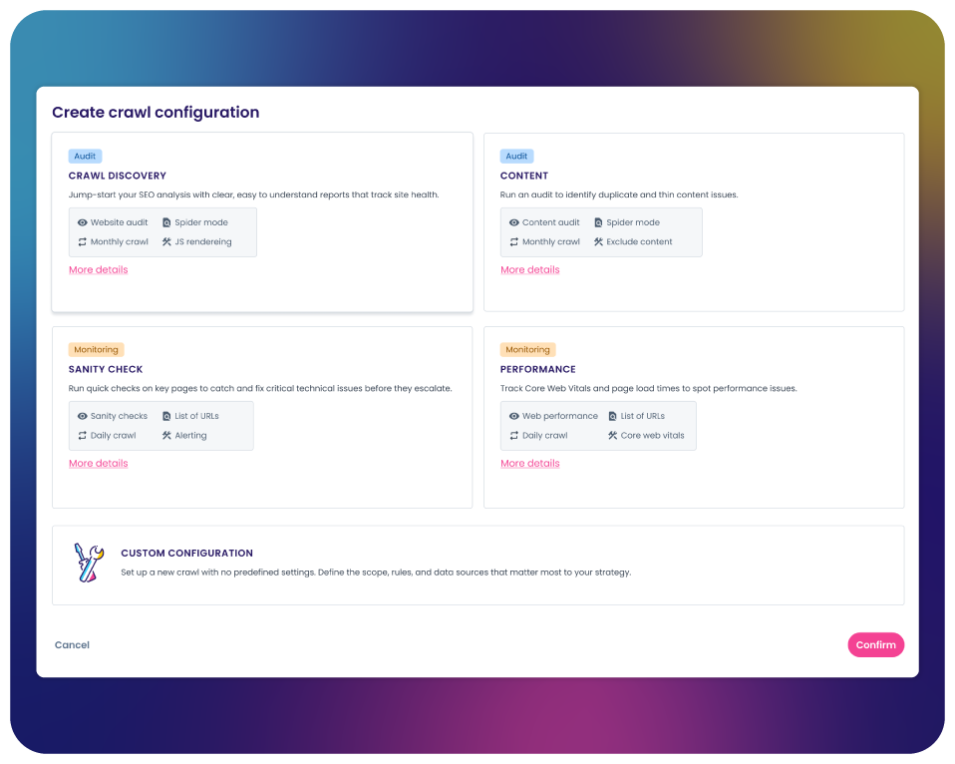
What Oncrawl offers
Combine crawl, log, and performance data in one place to understand how technical factors influence visibility.
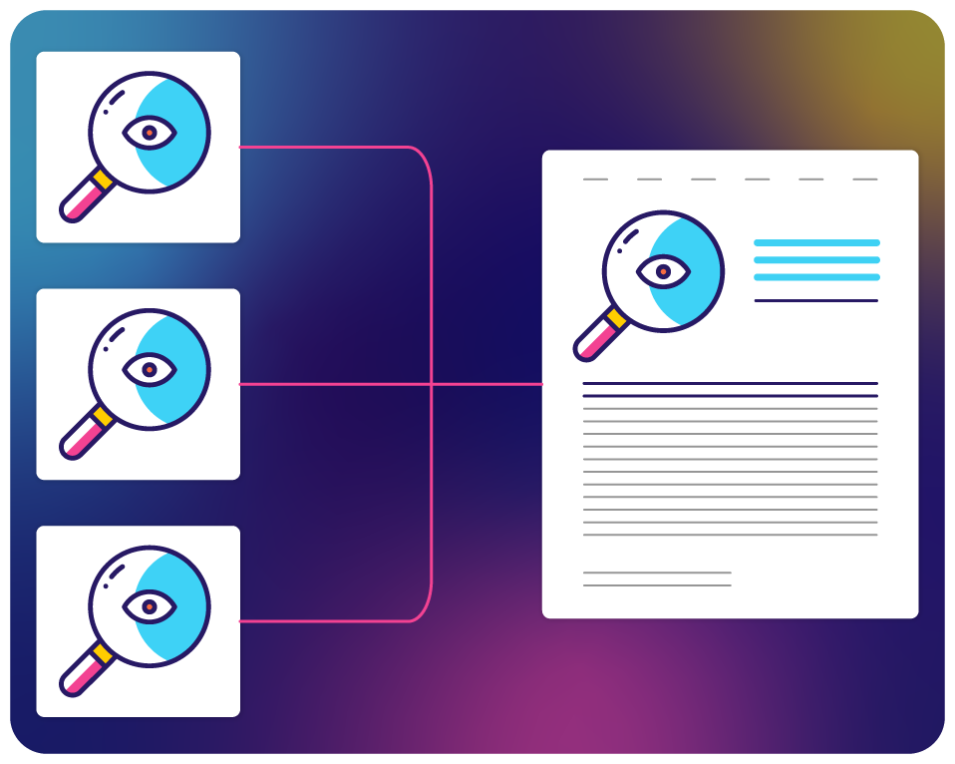
Enrich your analysis with ranking, analytics, backlinks, and custom data from third-party sources.
Group pages dynamically by any metric and apply segments retroactively to reveal trends that aggregated views would hide.
Connect the dots between technical SEO and
search performance
Understand what drives your visibility
Combine data sources and explore correlations to go from knowing that something changed to understanding why.
- Cross-reference crawl metrics with ranking data to identify what correlates with visibility gains or losses.
- Layer log data onto performance signals to see whether search engines are reaching the pages you’re optimizing.
- Use dynamic segmentation to isolate page groups and compare behavior across site sections or templates.
- Spot patterns that only emerge when multiple data types are analyzed together.
Track and monitor your search performance
You can’t improve what you can’t measure and you can’t defend your work without reliable data.
- Monitor how your pages rank across product groups, campaigns, or brand terms.
- Identify keyword cannibalization and pages competing for the same queries that should be consolidated.
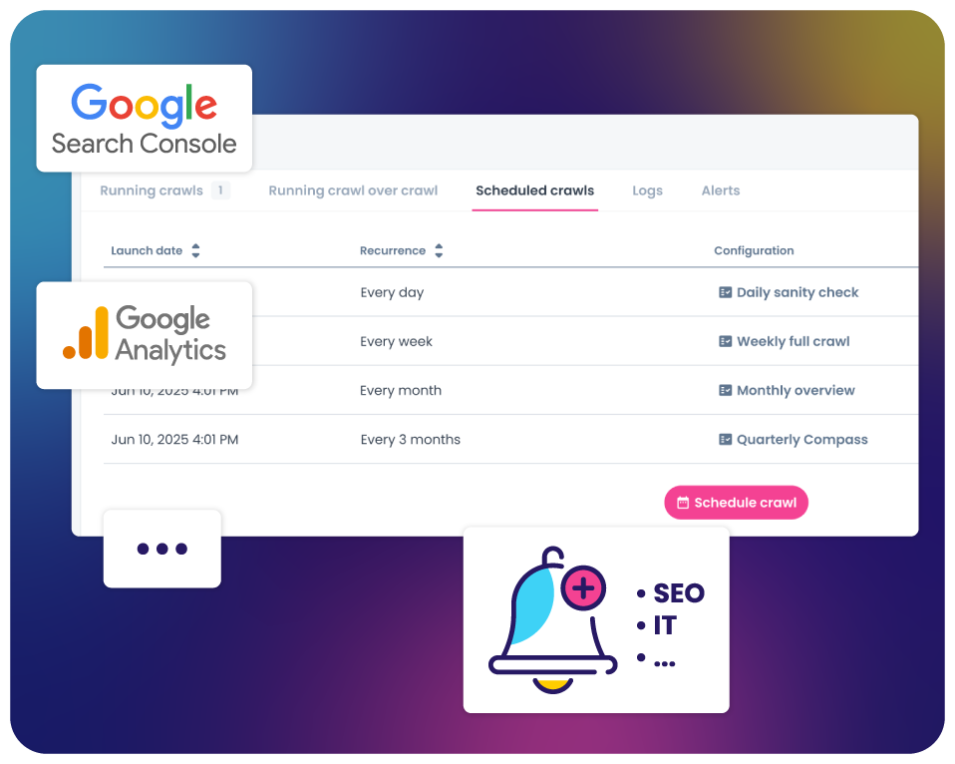
- Collect and preserve Google Search Console data beyond its standard retention limits.
Make your SEO insights shareable and defensible
Your team knows the work is getting done. The challenge is showing everyone else.
- Use guided analysis paths (Lenses) with pre-configured dashboards to get to insight without building reports from scratch.
- Share dashboards that translate technical findings into clear narratives for non-technical stakeholders.
- Demonstrate before-and-after impact in a format decision-makers can understand.
The insight your team needs to prove impact
See what Oncrawl can do for you
Book your demo (nouvelle fenêtre)Our clients' results speak for themselves
"I'd recommend Oncrawl for technical SEO challenges."
Discover all our client success stories (nouvelle fenêtre)“What I really enjoy is that you have pre-defined reports but can also export all the data raw if you like. Big bonus points for the seamless API. Even bigger bonus points for being able to cross-reference with the GSC API and even simple spreadsheets – huge value add when building custom SEO models.”


"Oncrawl: My Go-To for Technical SEO"
Explore Booksy (nouvelle fenêtre)“Oncrawl is key for analyzing large marketplaces and tracking Googlebot. Its strength: combining crawl data, bot hits, and external sources to uncover high-impact SEO actions. I also love the scraping feature and insights on emerging bots like ChatGPT.”


"Reliable, Insightful & Actionable for Large Sites"
Visit our blog for SEO insights (nouvelle fenêtre)“Oncrawl is my go-to for large sites. Reliable and clear, it visualizes data and offers powerful segmentation. The monitoring system detects issues early. Combining crawl and live log analysis, it helps make smart SEO decisions that improve performance and ROI.”

"Highly recommend Oncrawl’s suite of tools"
Learn more about Roast (nouvelle fenêtre)“Oncrawl is a fast, scalable tool that helps our team deliver technical audits on large sites. Its speed makes it easy to spot crawlability and indexation issues, and automated reports simplify client communication. Strong integrations enhance our analyses, making Oncrawl highly valuable.”