
The understanding of log files data in SEO has increasingly increased in the SEO community. Log files are actually the only qualitative representation of what happens on a website. But we still need to be able to make them speak effectively.
Exact SEO visits and bots behavior are present in your log files. On the other hand, data from your crawl report can deliver a good knowledge of your onsite performance. You need to combine your log files and crawl data to highlight new dimensions when analyzing your website.
This article will show you five excellent ways to combine crawl and log files data. Obviously, there are many more you can use.
1# Orphan page detection and crawl budget optimization
What is an orphan page? If an URL appears in the logs without being in the architecture of the site, this URL is called orphan.
Google has a colossal index! Over time, it will keep all the URLs it has already discovered on your website, even if they are no longer present in the architecture (slug change, deleted pages, complete site migration, external links in error or transformed). Obviously, letting Google crawl these so-called orphaned pages can have an impact on optimizing your crawl budget. If obsolete URLs consume your crawl budget, this prevents other URLs from getting crawled more regularly and will necessarily have an impact on your SEO.
When crawling your website, Oncrawl goes through all the links to discover, depth by depth, the complete architecture of your site. On the other hand, during log files monitoring, Oncrawl compiles data from Google bots hits and SEO visits.
The difference between URLs known by Google and those that are linked in the architecture can be very important. SEO optimizations that aim at correcting forgotten or broken links and reduce orphaned pages are essential.
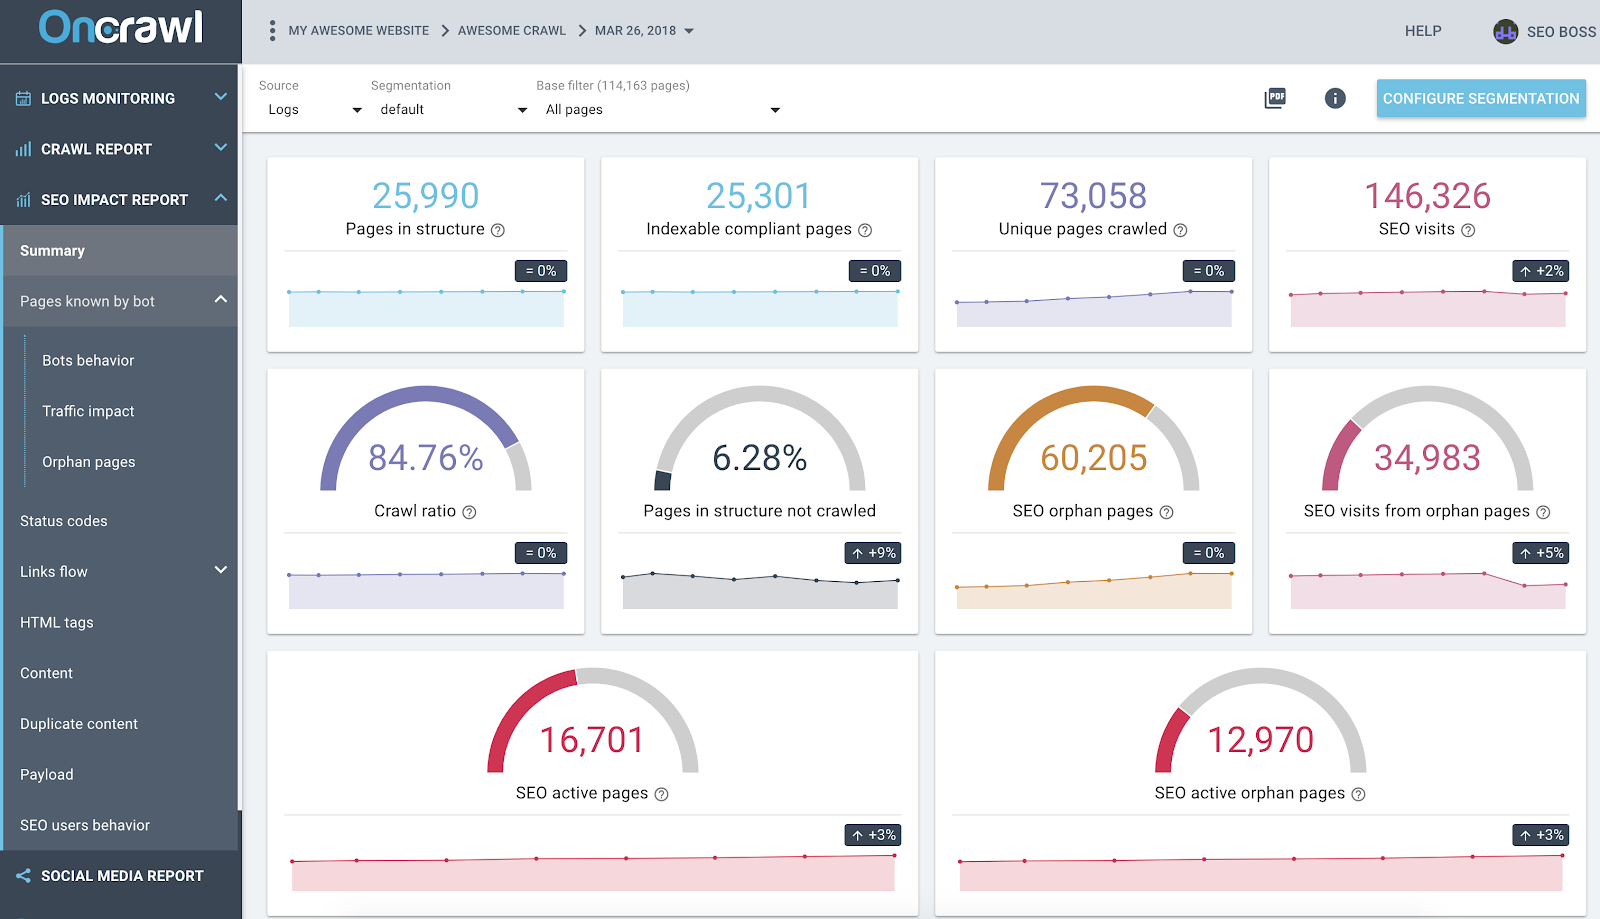
Oncrawl SEO Impact Report based on Logs and Crawl cross-data analysis
The screenshot above gives a state of the art of your logs and crawl data. You can quickly notice that:
- 25,990 pages are in the structure – found by our crawler and taking into account all the links it has followed on the website;
- 73,058 pages are crawled by Google – this is 3x more than in the structure;
- A crawl ratio of 84% – (Oncrawl crawled pages + actives pages from logs + Google crawled pages ) / Google crawled pages;
- More than 6% of the internal pages are not crawled – just click on the black bucket to have the list of these pages in the Data Explorer;
- 60K orphan pages – the delta between pages in the structure and pages crawled by Google;
- 34K SEO visits on these pages – it looks like there is an issue on the internal linking!
Best Practice: Oncrawl gives you the advantage to explore data behind each graph or metric just by clicking on it. This way, you will obtain an downloadable list of URLs that are directly filtered on the scope you have been exploring.
2# Find out which URLs consume the most (or the least) crawl budget
All events from Google bots visits are known by the Oncrawl data platform. This allows you to know – for each URL – all the data compiled according to time.
In the Data Explorer, you can add for each URL bot hits columns (over a 45 days period) and hits by day and by bots, which is an average value per day. These informations are valuable to evaluate the consumption of Google crawl budget. You will often find that this budget is not uniform on all sites.
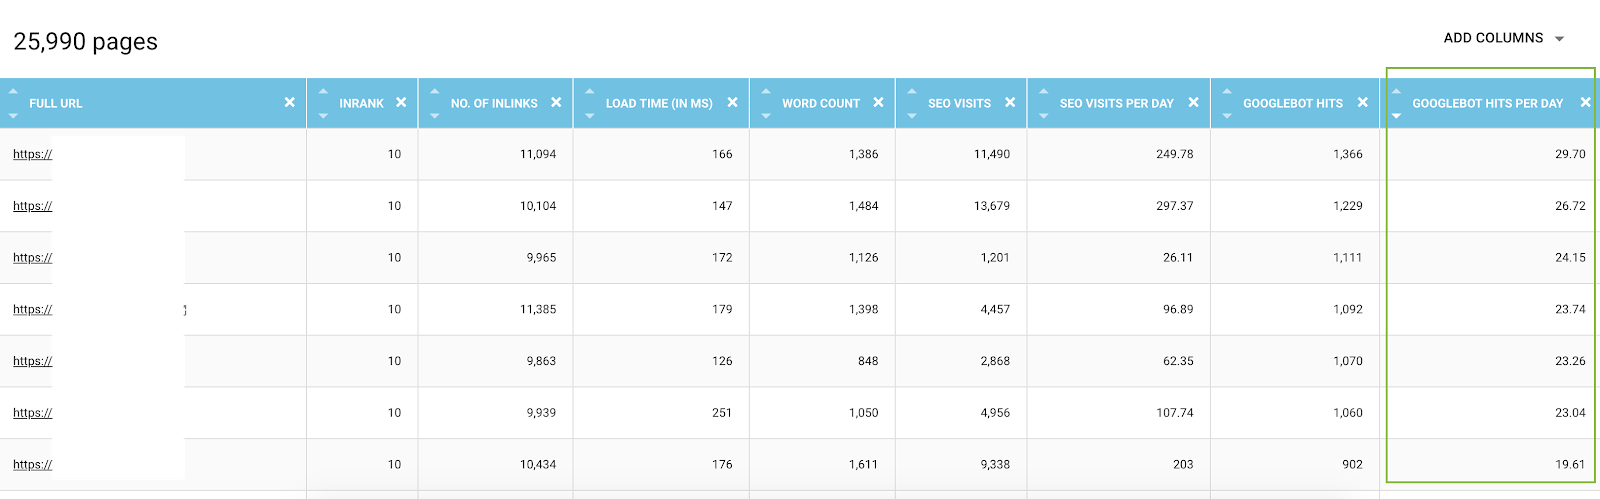
List of all URLs from the Data Explorer with crawl metrics and filtered by bot hits by day
In fact, some factors can trigger or reduce the crawl budget. We have then established a list of the most important metrics in this article about the Google page importance. Depth, number of links that point to a page, number of keywords, page speed, InRank (internal popularity) influence bots crawling. You will learn more in the following paragraph.
3# Know your best SEO pages, your worst SEO pages and determine the success factors of pages
When using the Data Explorer, you have access to key metrics about pages – but it can be complicated to compare hundreds of lines and metrics together. Using columns to segment on bot hits by day and SEO visits by day is an ally in your data mining.
- Download the CS – Bot Hits by Day and CS – SEO visits by day JSON files;
- Add them as new segmentations.
In fact, you can create segmentations based on these two values resulting from the log analysis to have a first distribution of your pages by groups. But you can also filter through each group of these segmentations to quickly detect – in each Oncrawl report – which pages are not reaching the expected values.
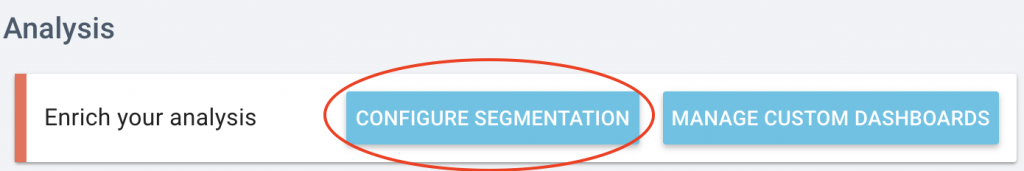
On your project homepage click on the “Configure Segmentation” button.
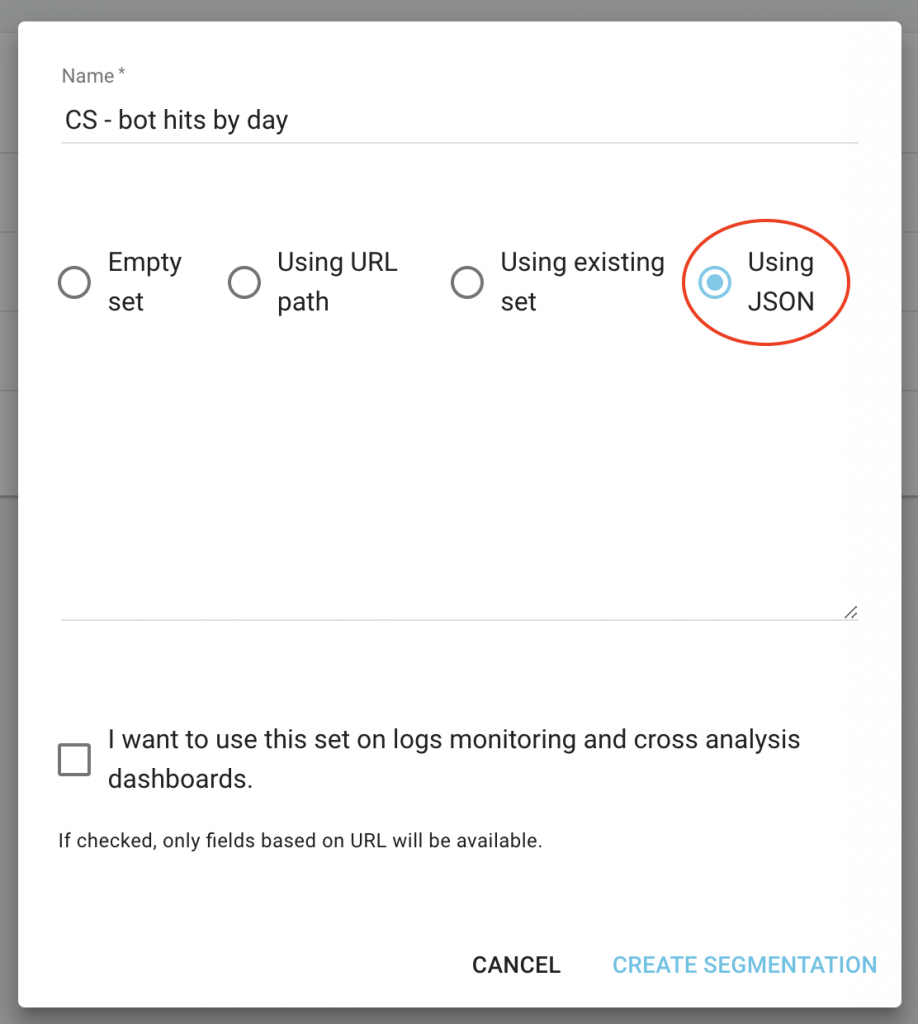
Then Create a new segmentation

Use the JSON import by choosing the “Using JSON” capacity and copy/paste the files you have downloaded.
Now you can switch segmentations using the top menu on each report.
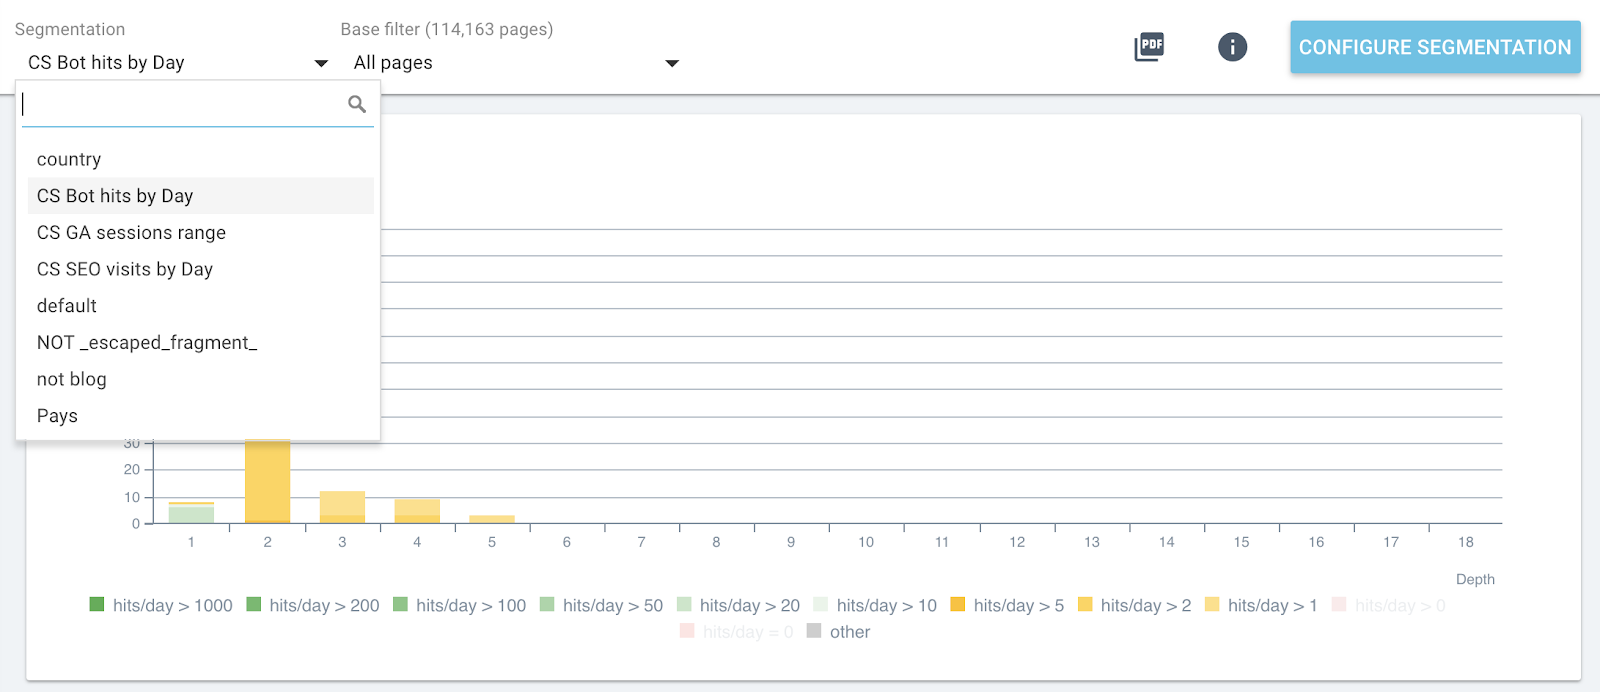
Live segmentation change in all Oncrawl reports
This will give you on each graphic the impact of the metrics you are analyzing and related to pages grouped by bot hits or SEO visits.
In the following example, we have used these segments to understand the impact of the InRank internal popularity – based on the power of links by depth. Moreover, bot hits and SEO visits are correlated on the same axis.
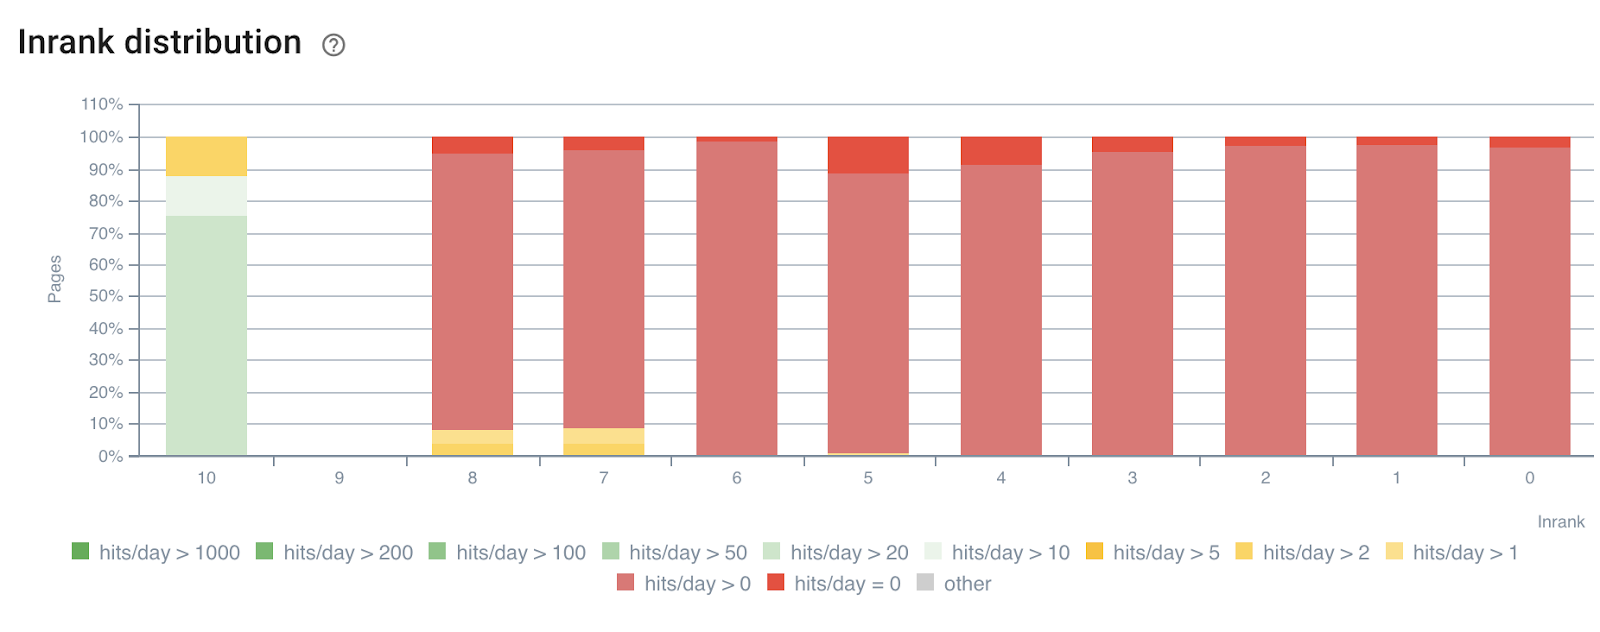
InRank distribution by bot hits by day
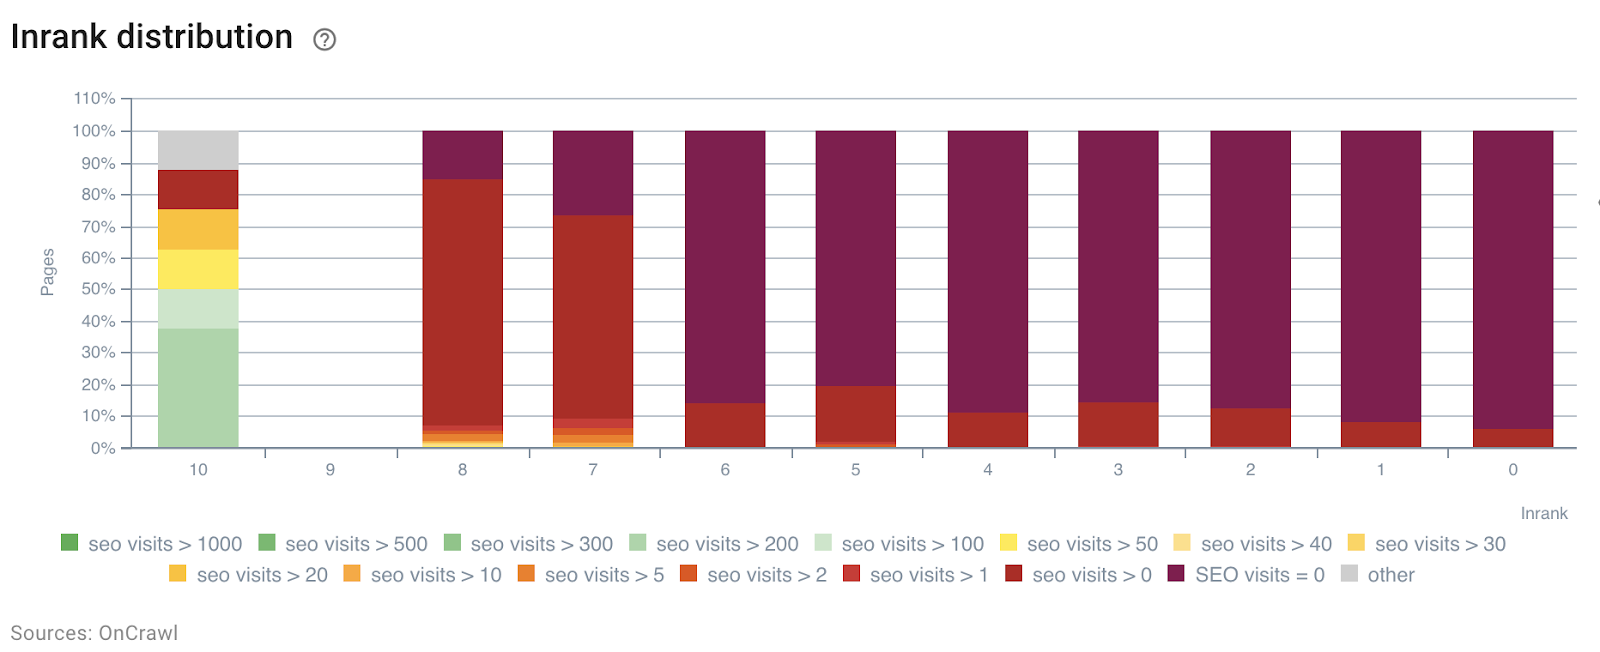
InRank distribution by SEO visits by day
The depth (the number of clicks from the homepage) has clearly an impact on both bots hits and SEO visits.
In the same way, each page group can be selected independently to highlight data from the most hited or visited pages.
This allows to quickly detect pages that could perform better if they were optimized, number of words in the page, depth or number of incoming links for example.
Just pick the right segmentation and the group of pages you want to analyze.
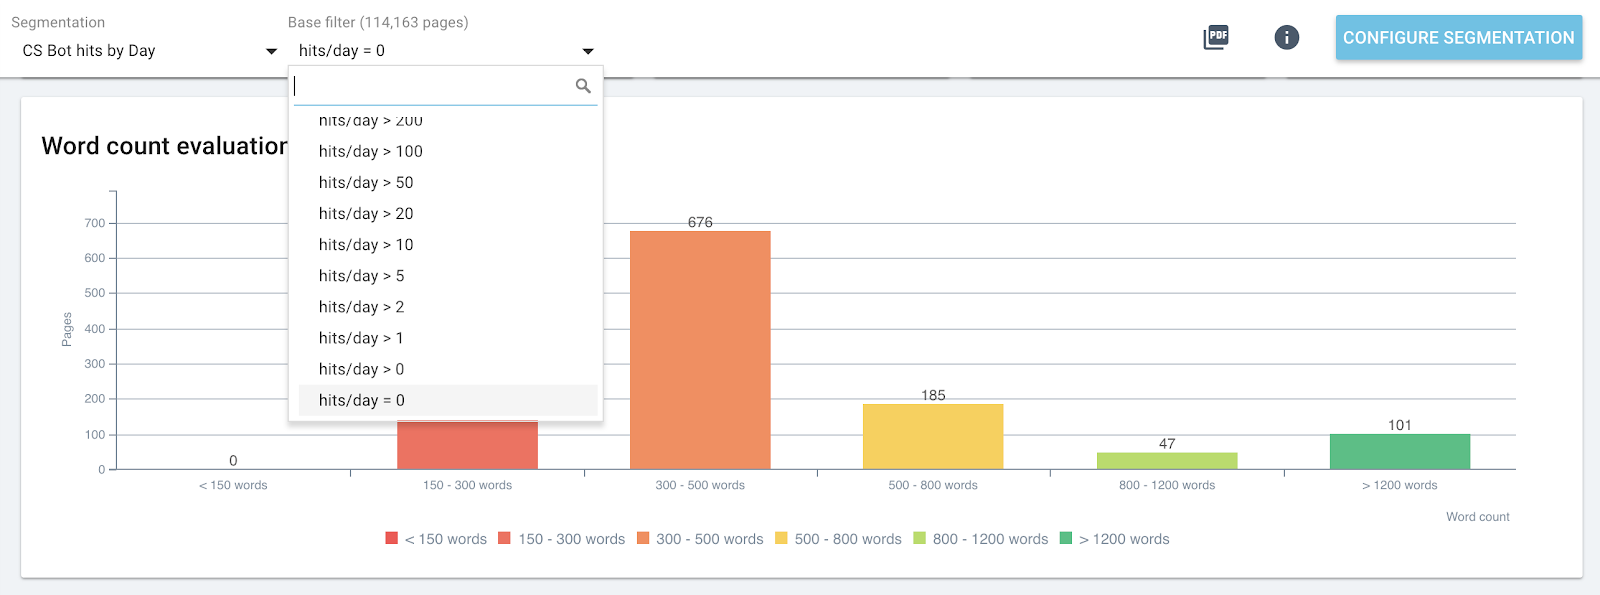
Word distribution in the page for the group containing 0 bot hit by day
4# Determine threshold values to maximize crawl budget and SEO visits
To go further, the SEO Impact Report – crawl and log cross-data analysis – can detect threshold values that help increase SEO visits, crawl frequency or pages discovery.
Impact of the word count on the crawl frequency
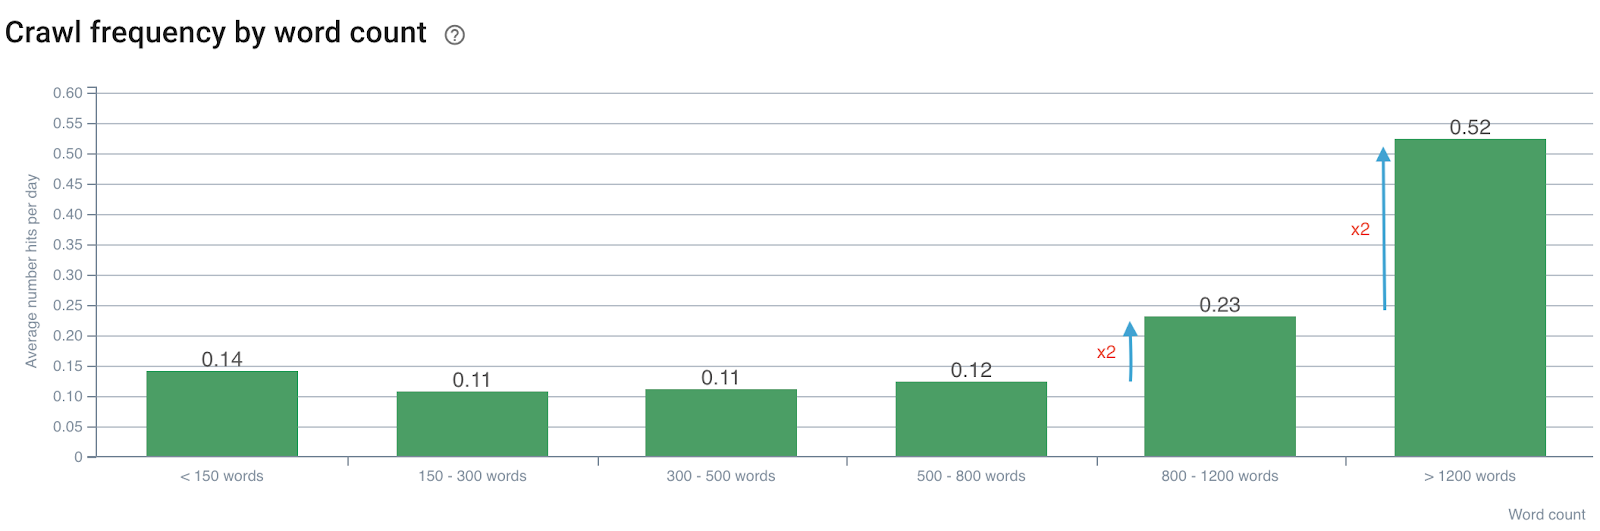
Crawl frequency by number of words
We note that the crawl frequency is doubled when the number of words exceeds 800. Then, it’s also doubled when the number of words in the page exceeds 1200 words.
Impact of the number of inlinks on the crawl ratio
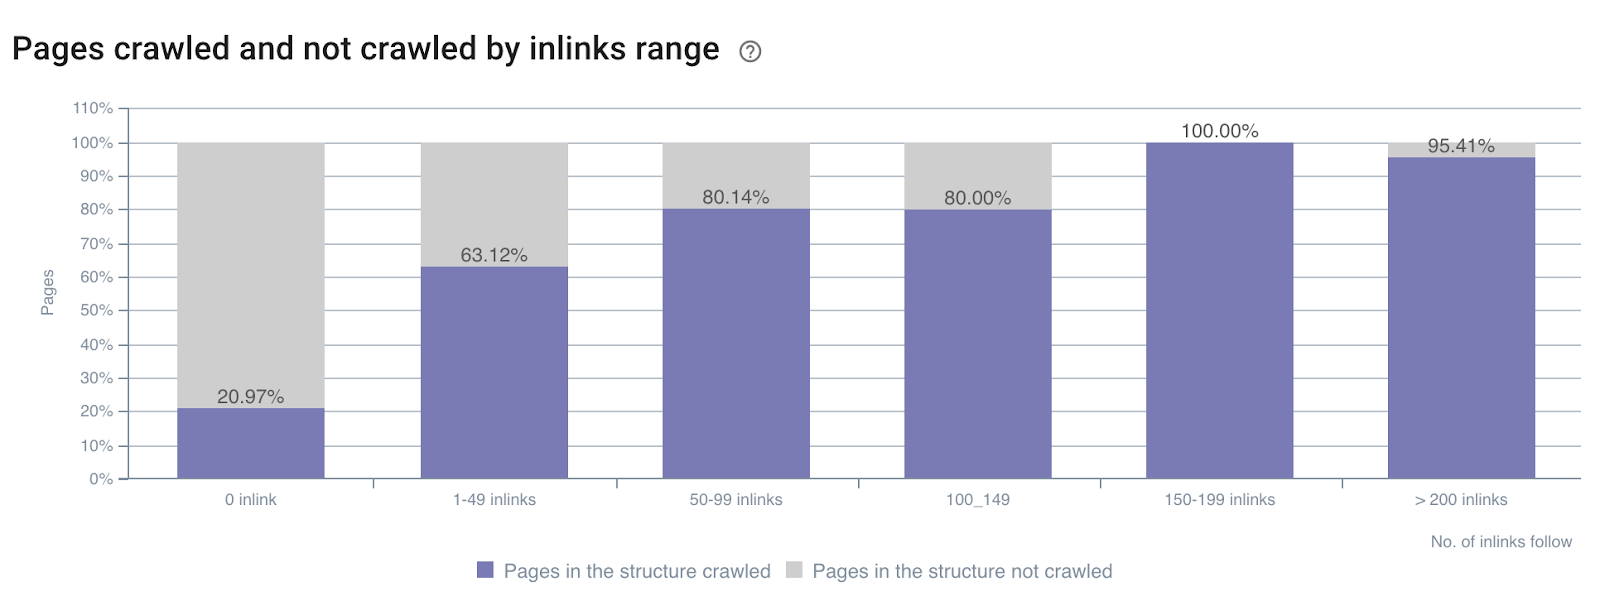
Crawl ratio by number of inlinks all over the site
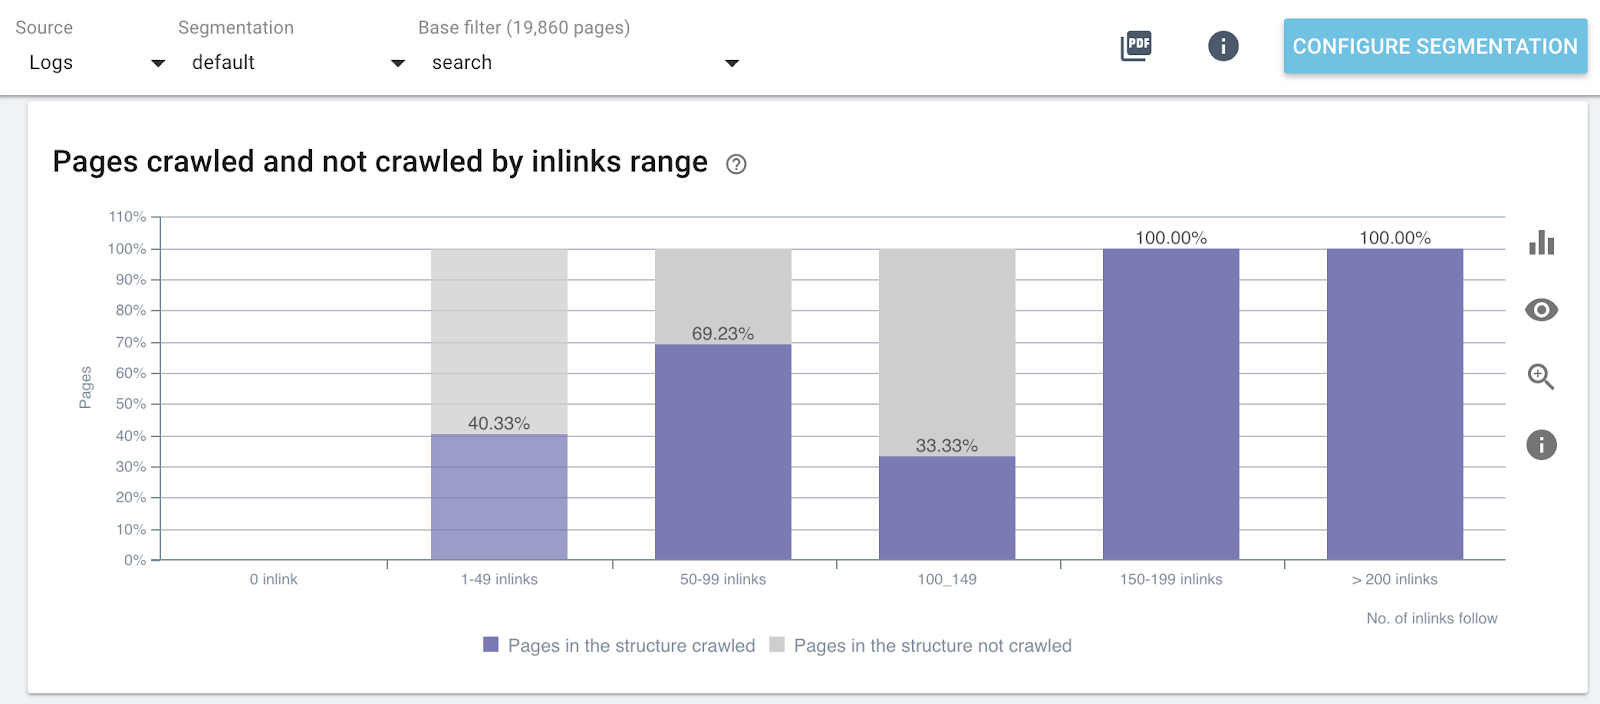
Crawl ratio by number of inlinks on specific parts of the website (Search Pages)
Impact of depth on the activeness of the pages
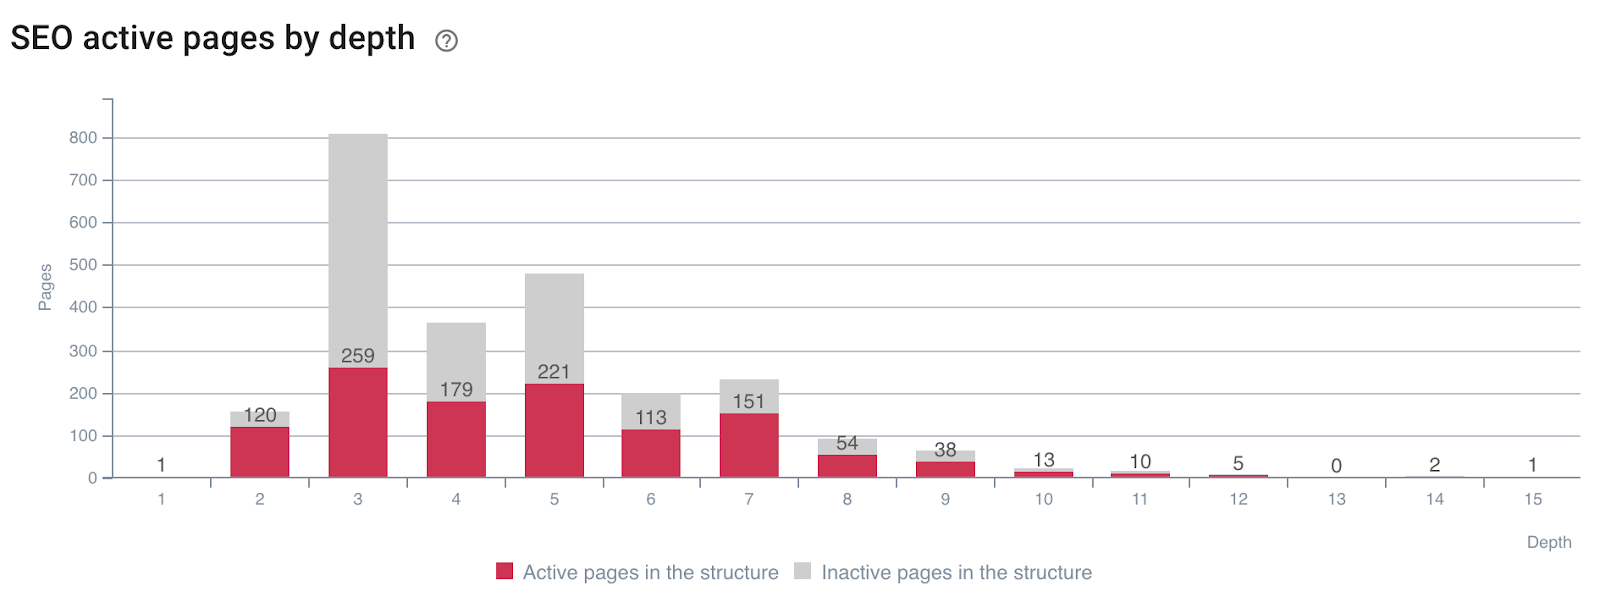
Pages generating SEO visits (or not) by depth
You can see that having the right site metrics during a crawl and crossing logs data allows you to immediately detect what SEO optimizations are needed to manipulate Google’s crawl and improve your SEO visits.
5# Determine how SEO ranking factors influence your crawl frequency
Imagine if you could know what values to target to maximize your SEO? That is what the cross-data analysis is made for! It allows you to determine precisely, for each metric, at which threshold crawl frequency, crawl rate or activeness are maximized.
We saw above – on the example about the number of words per page and the crawl frequency – that there are crawl frequency trigger values. These gaps must be analyzed and compared for each type of page because we are looking for spikes in the bots behavior or SEO visits.
Like those presented below:
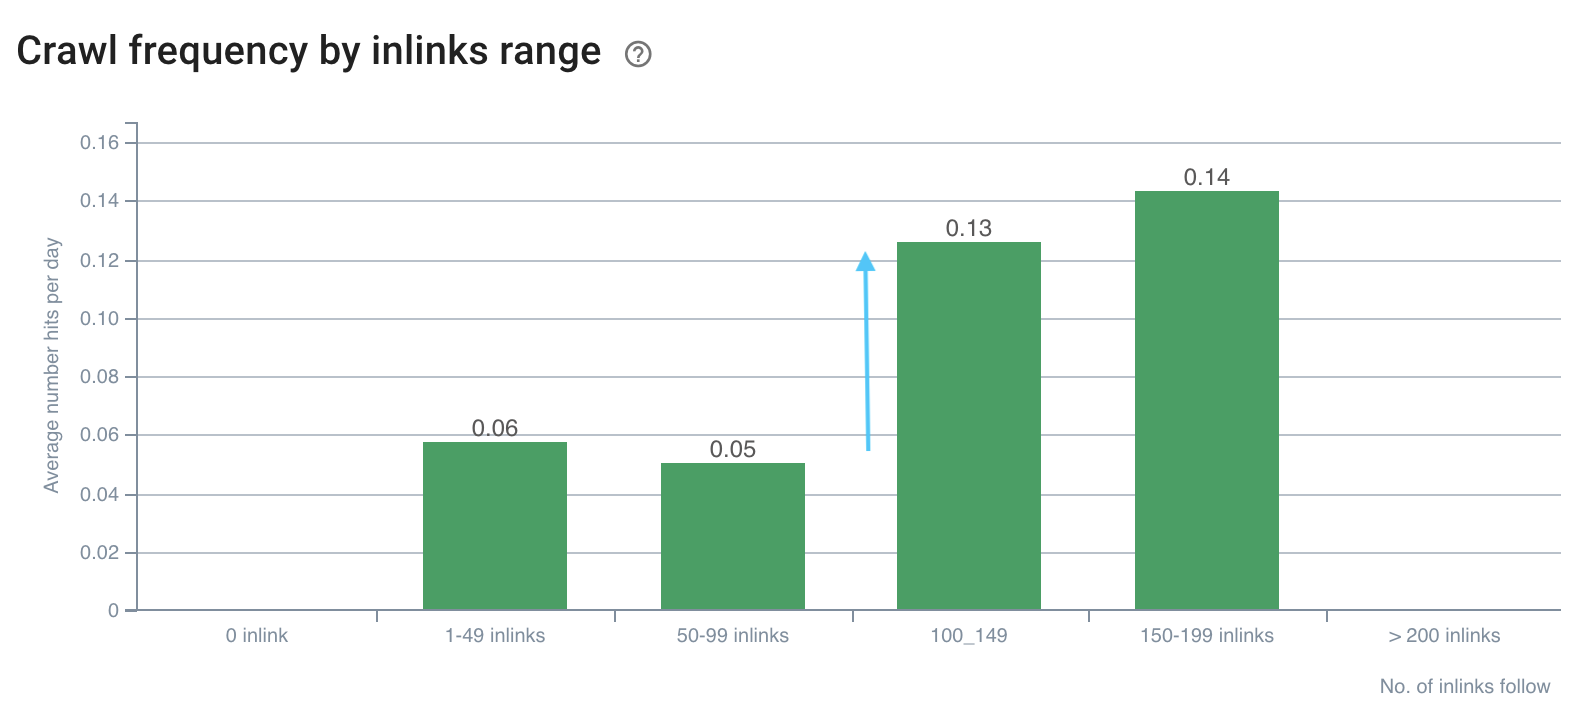
The crawl frequency has a gap on 100+ inlinks
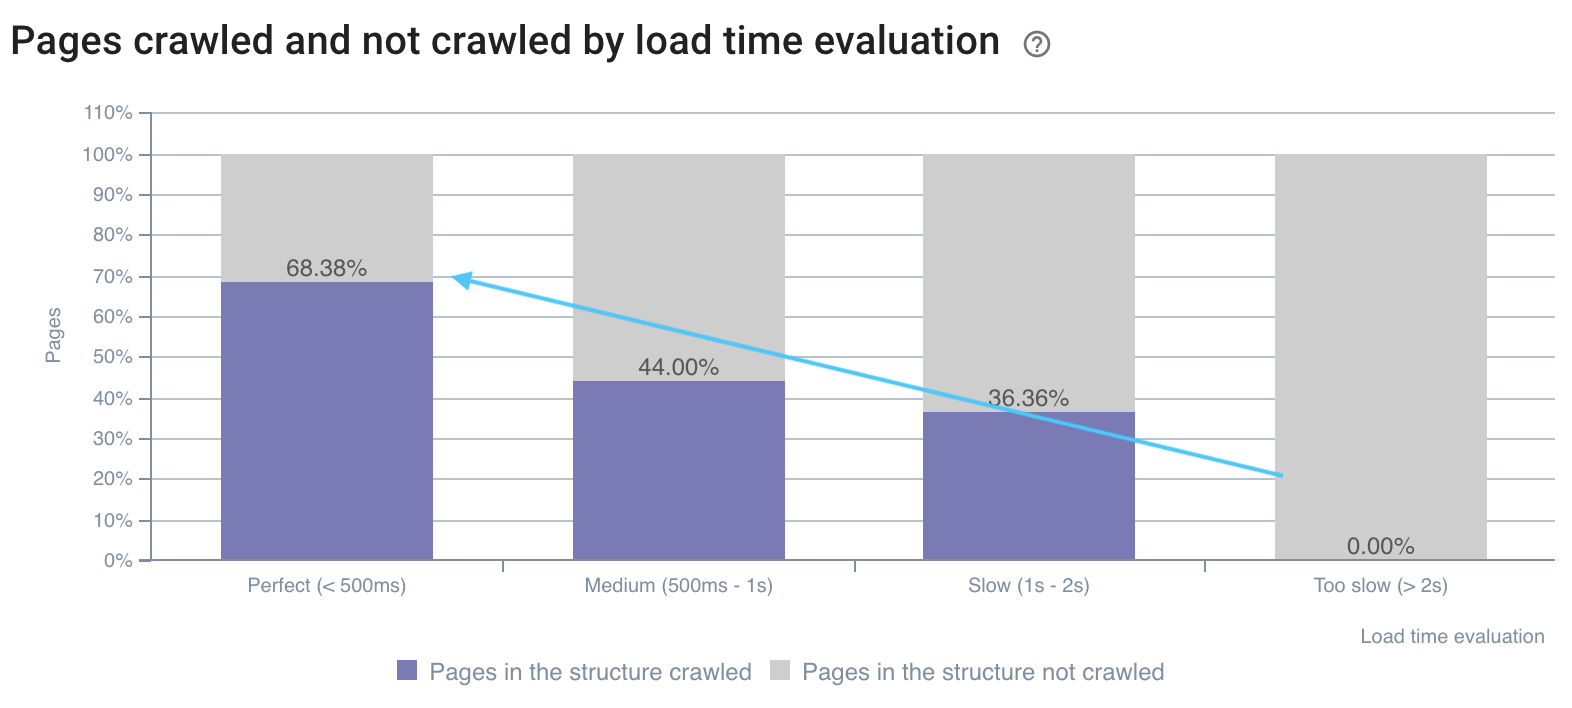
The crawl rate is better on fast pages
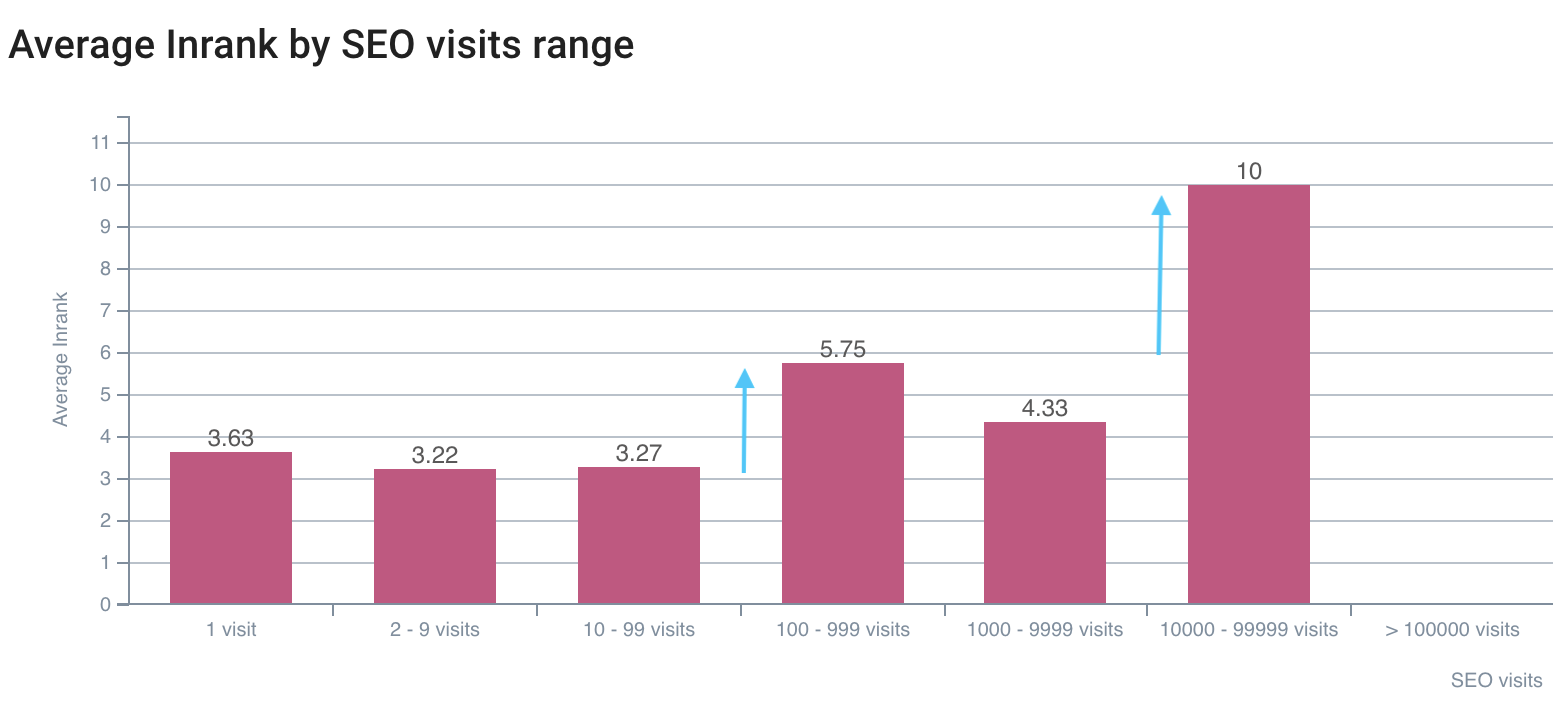
The first gap on SEO visits is on InRank 5,75, the best is on InRank 10 (homepage)
Combining crawl and logs data allows you to open the Google blackbox and exactly determine the impact of your metrics on bots crawl and visits. When implementing your optimizations on these analysis, you can improve your SEO at the time of each one of your releases. This advanced use is durable in time, since you can detect new values to reach at each cross-data analysis.
Any other tricks with cross-data analysis you would like to share?