
In Oncrawl’s Ranking Report dashboards, we talk about impressions and Googlebot hits the way many news sources talk about global or national wealth. Instead of talking about the 1% (richest people), though, we talk about the 10% (impression-richest pages) or the 10% (poorest pages in Googlebot hits).
This lets you examine the edge cases: the really successful or the really poor pages on your site in terms of ranking and performance. It lets you visualize the distribution of SEO wealth (that is, Googlebot hits and SERP impressions) across your site. Is your site equitable, or are some pages really rich and others really poor?
And more importantly, should your site evenly distribute SEO wealth across all of your pages, or is unequal wealth a useful indication that something can be optimized elsewhere?
How deciles work in Oncrawl
As with wealth, impressions are not distributed equally across your pages. Neither are Googlebot hits. Some pages get more than others.
To better visualize this type of inequality, Oncrawl provides a number of charts that use deciles. In other words, after sorting your pages by number of impressions (or by Googlebot hits) earned, these charts then divide your pages in ten groups, each containing the same number of pages.
For impressions, these groups are set up like this:
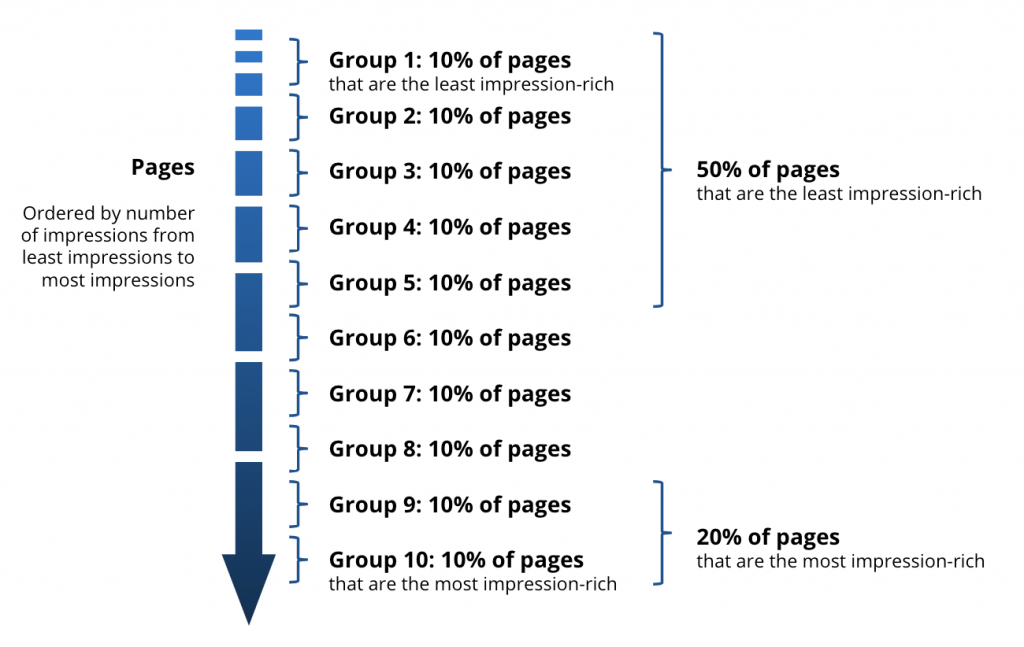
Oncrawl Trick: Since all of the groups contain the same number of pages, they’re easy to add: five groups represent 50% of the total pages; two groups represent 20% of the total pages…
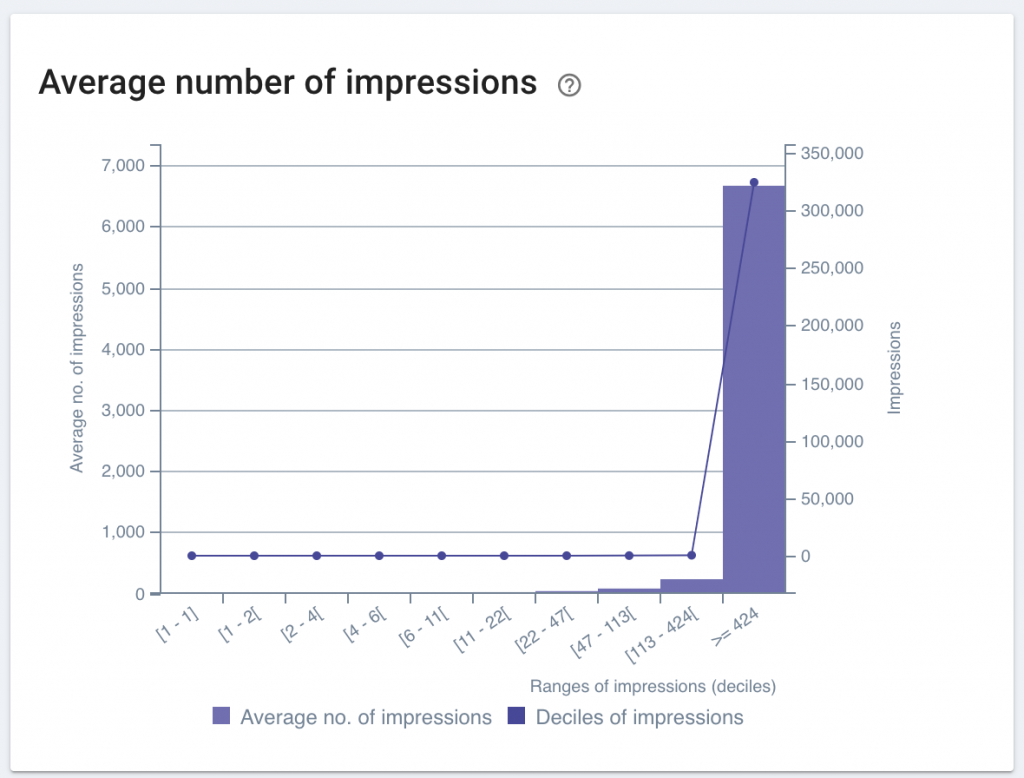
Each decile of pages is represented by a column on the graph, with a bar measuring certain data for that group of pages. The total impressions (or Googlebot hits) is represented by a line across the bars.
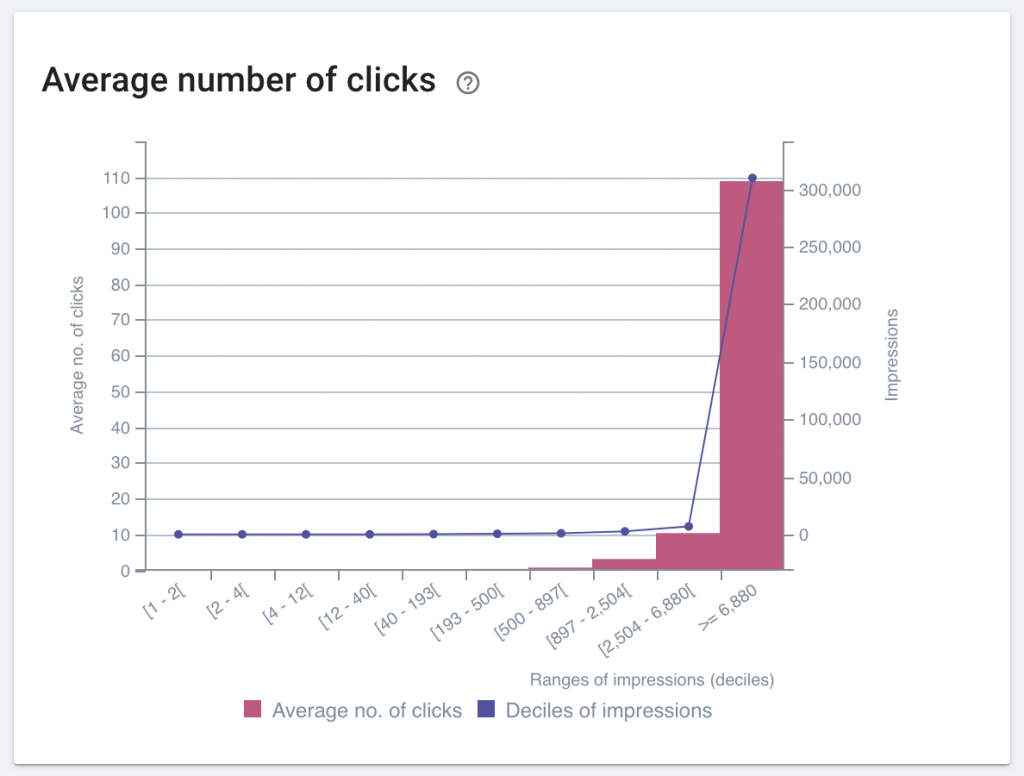
The pink bar shows the average number of clicks per page in a given decile. Each bar represents 10% of the total pages. (It’s pretty clear from the bar at the right that 10% of the pages receive way more clicks per page than the other 90% of pages combined.) The purple line shows the distribution of total impressions for each group of pages.
You can examine the following data using deciles:
Deciles of pages ordered by number of impressions
- Average number of impressions
- Average number of clicks
- Ranking pages in the structure
- Distribution by depth
- Distribution by Inrank
- Load time of ranking pages
- Average number of “follow” inlinks to ranking pages
- Word count of ranking pages
- Title duplication status of ranking pages
Deciles of pages ordered by number of Google hits
- Ranking pages crawled by Google
- Number of impressions on pages crawled by Google
- CTR
Using decile data to find potential for quick-win optimization
Make relationships visible
Deciles can be useful to view important differences that aren’t visible in other graphs.
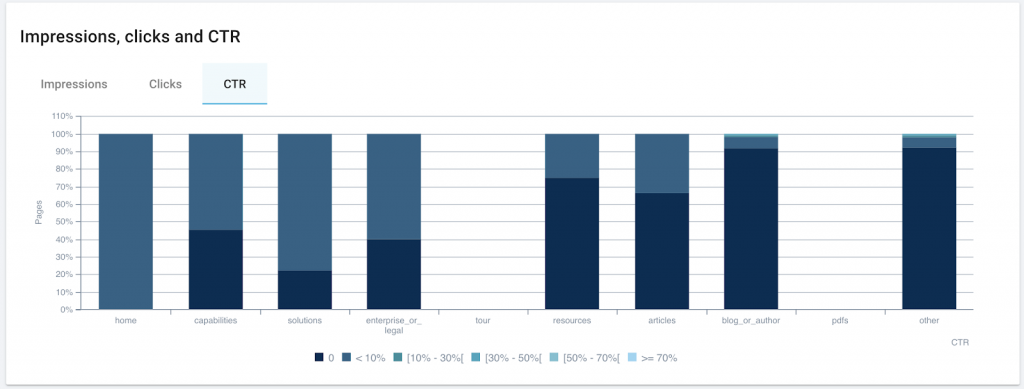
For example, trying to understand what might influence CTR, you might try looking at the distribution of CTR using different segmentations:
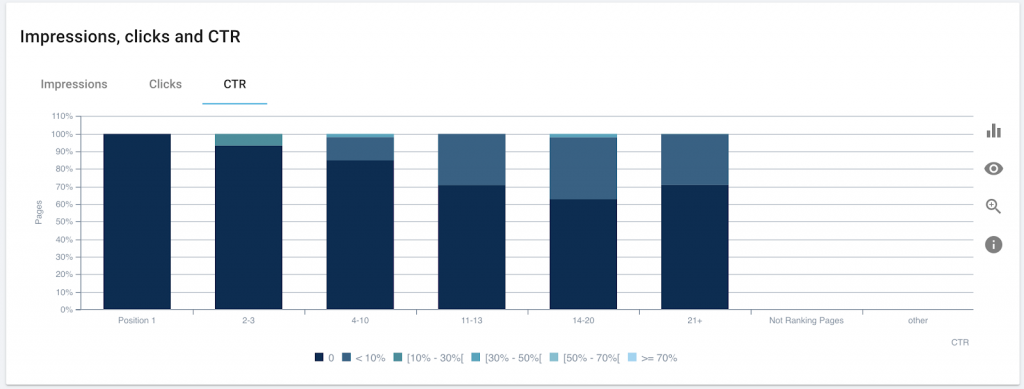
But when that doesn’t yield actionable insights, there may still be a clear relationship between bot hit frequency and CTR:
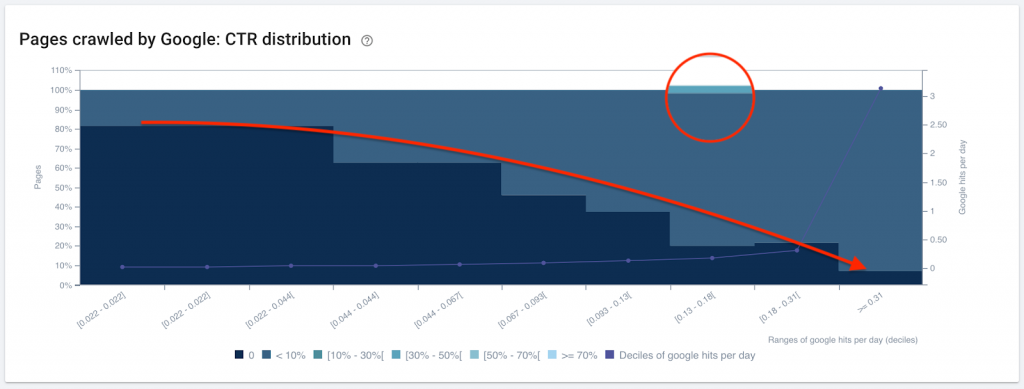
On this site, the more a bot visits a page, the more likely the page is to have a positive CTR. Additionally, the relatively high CTR in the third decile from the right would be interesting to investigate and duplicate, and the CTR of zero in the first column on the right is a great place to start optimizing.
Spot quick wins using edge cases
SEO projects take up time and resources. Which pages do you prioritize?
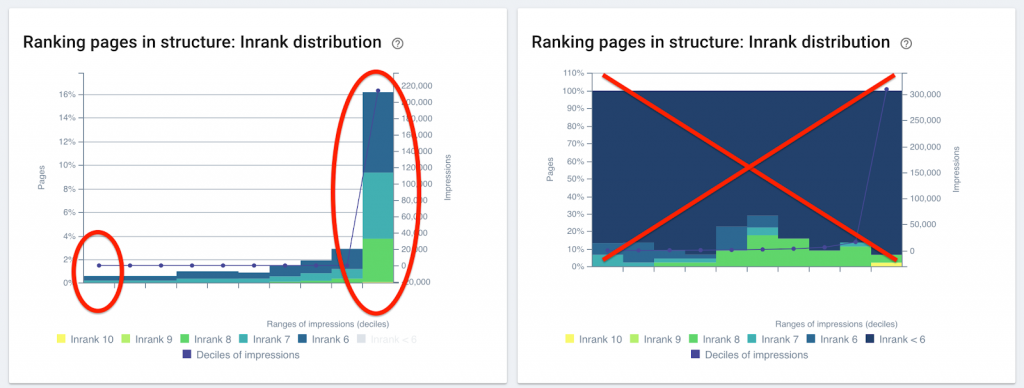
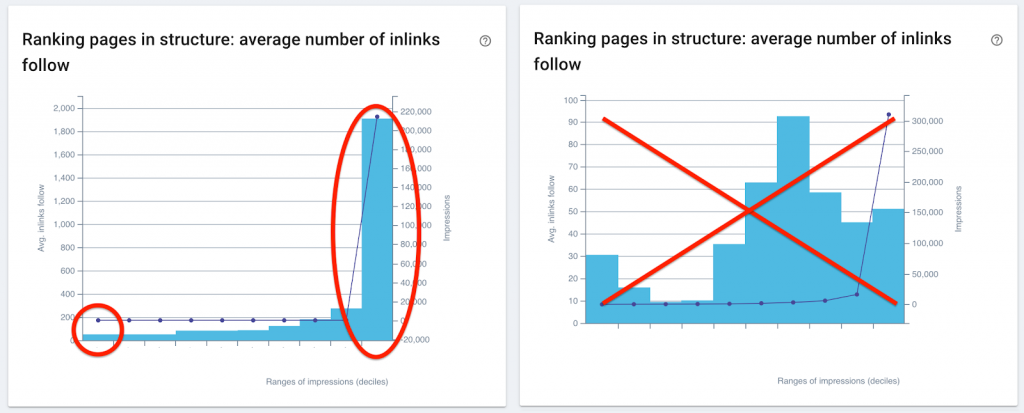
If your charts show a correlation between ranking factors and page deciles for impressions, you can see significant improvements in performance by concentrating:
- on the 10% of pages that do very well: seemingly small improvements have a big impact because the pages pull a lot of weight in number of impressions.
- on the 10% of pages that do very poorly: the potential for improvement based on relatively simple-to-implement optimizations is massive for these pages.
Here are a few examples of when edge cases present a good case for quick-win optimization, and when there isn’t enough correlation to expect significant results:
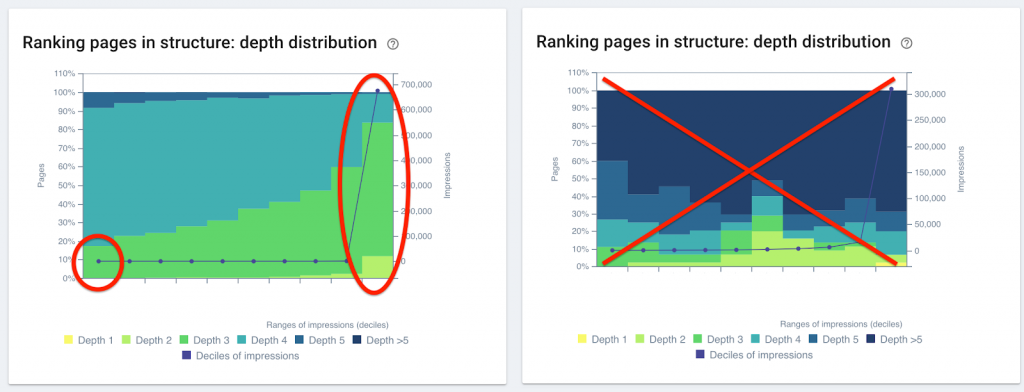
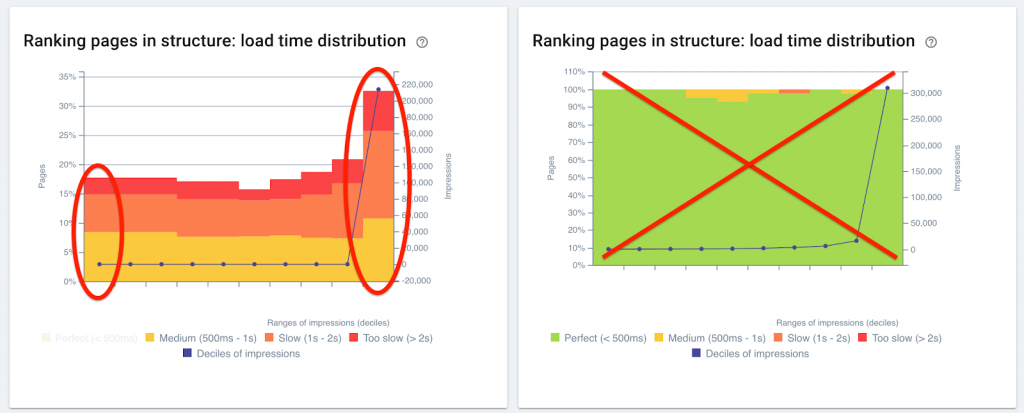
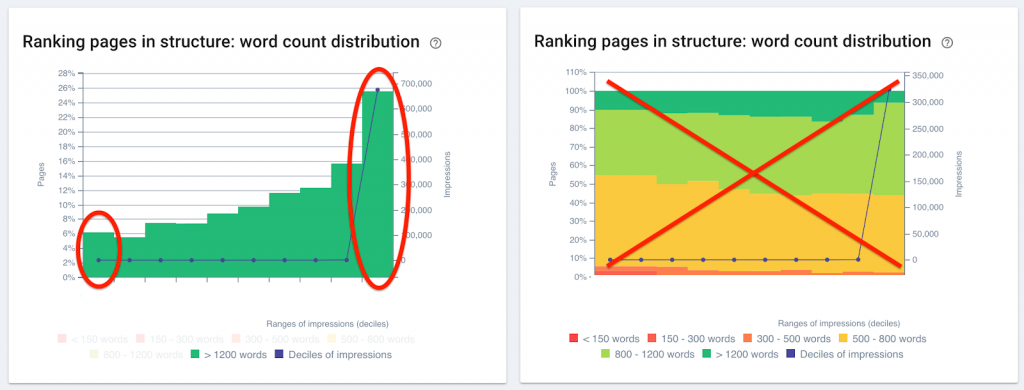
It your turn to use statistics and edge cases to find SEO quick wins
A statistical approach to data can help reveal trends and correlations that aren’t visible when just looking at the numbers. The Oncrawl decile charts can show you how SEO performance, measured in SERP impressions and Googlebot hits, is distributed throughout your site.
If you’ve determined that the top- or lowest-performing pages are significantly different from the average page, you’ve found edge cases where optimizations can present SEO quick-wins. To help you identify opportunities for improvement, Oncrawl’s cross-analysis examines how ranking factors relate to SEO performance on your site.