
Before we begin to optimize a website, we typically do a complete audit: we collect the data, prioritize actions, and then get to work.
In these cases, it’s important to follow a plan and to cover the principal points designated in the plan, step by step.
This process keeps us concentrated on what’s most important, but it also gives us a limited vision of what’s happening on the website.
This is why it’s important to have ways to monetize a website and assign metrics that will tell us if things are working well or not, and how our actions make the website evolve.
In this case, we’re going to concentrate only on metrics that impact SEO.
We’ll divide the metrics relating to the health of a website into three groups to make them easier to conceptualize. This will give us metrics for:
- Web performance
- Content
- Off-site
Greatly simplified, these are the three priortary sections to take into account when optimizing a website.
Keep in mind that even though we’ve separated metrics into three sections, there are correlations between each section, and they can influence one another. For example: poor user experience on a page that is served very slowly will impact traffic, and this might influence a loss of users, along with a loss of ranking.
Website SEO Performance
This is the technical section of the website, in which we can have control over the smallest details, if we want. On an SEO level, the main idea is to monitor things that “break”, how the website renders, and what Google does on our website.
Increased page loading speed
This is one of the most important subjects to monitor, and every thousandth of a second can impact the revenue that that an Ecommerce site can gain or lose. It’s not easy to maintain full control over this part, but we can keep an eye on how things are evolving and which pages seem slow.
On one hand, within Google Analytics, we can see the site speed report. We can also configure a weekly email notification with the slowest pages on the website, or with the speed of the pages that most users receive.
What’s more, we can create segmentations for pages that interest us most, differentiating between desktop and mobile devices, geographic regions, channels…
Search Console has also recently added a section in which we can see tendencies in this area in a visual form.
We can also opt for paid tools like Pingdom, in which we can find additional data, with which we can monitor server response times, downtime, or user behavior analysis.
Oncrawl has dedicated sections for these problems, and crawl by crawl we can see how these pages evolve. We can see slow pages on our site, and which of the most-visited pages are slow, for example.
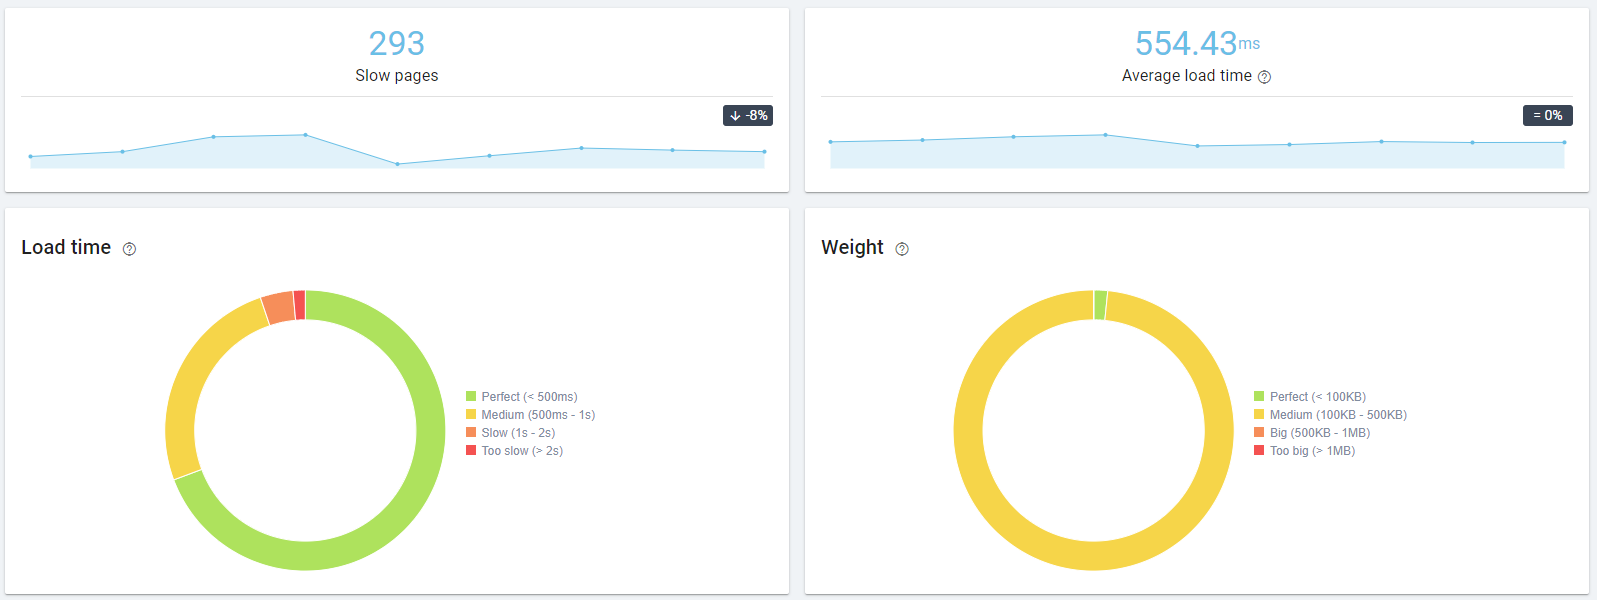
Monitoring load time and page size in Oncrawl
Crawl errors
This part is extremely important, since we’re generally not aware when there are crawl issues until we log into Search Console.
One recommendation is to visit Search Console regularly, and whenever we receive reports of this type, since Google sends notifications when there are peaks in tendencies in this type of problem.
[Case Study] Optimize organic search traffic using log files analysis

Use with mobile devices and usability
This section carries increasing weight, since web traffic is tending towards increased use of these type of devices.
And once again, Search Console will provide data on what happens on this type of page, and even includes a dedicated section.
At the same time, we can also configure alerts which will notify us of a drop in traffic of over 10% from one week to another in Google Analytics.
Indexing Status and Crawl Statistics
The indexing status and crawl statistics are something else that we can consult in the old Search Console interface and in the new coverage report.
This report offers data on anomalies in the number of pages crawled per day, or tells us whether big changes such as migrations are evolving as they should.
If we’ve configured log monitoring, such as the log monitoring offered by Oncrawl, the data available to us will have much more context, since we can apply these data individually to different sections of the website, or use them to identify crawl problems that would otherwise be impossible to detect without this visualization.
Additionally, with the Crawl over Crawl option, we can see changes in the website from one week to the next, for example, if you configure weekly crawls.
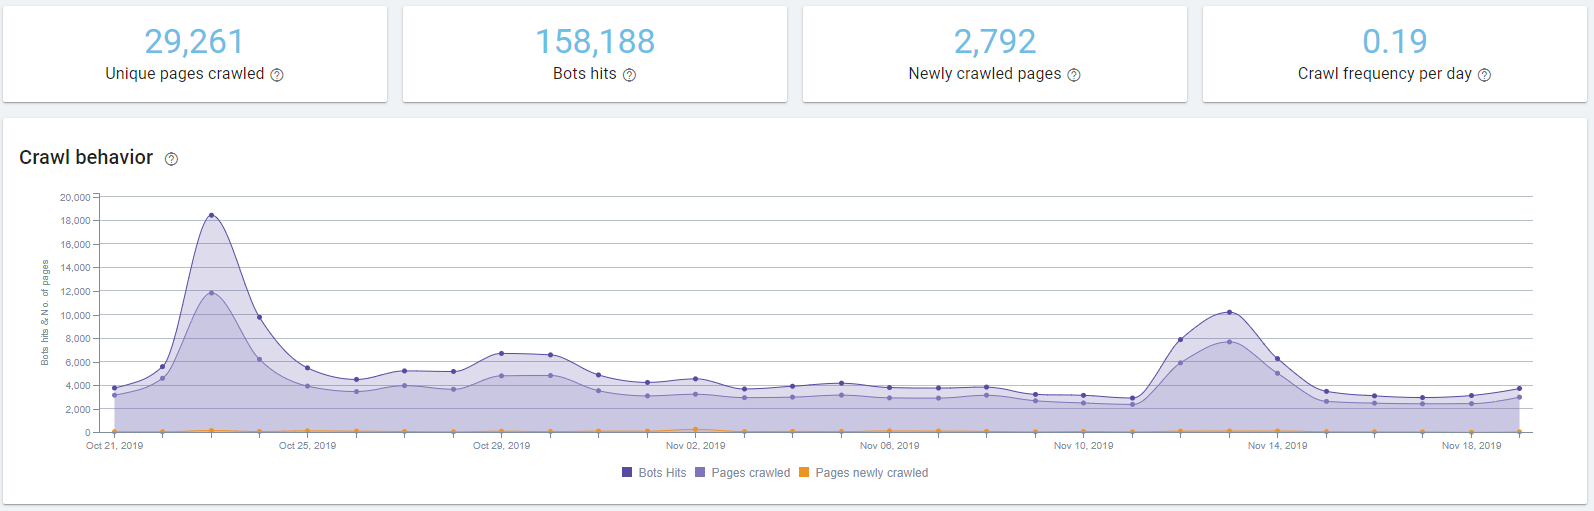
Monitoring Googlebot behavior on a site with Oncrawl
HTTP Status Codes
The dream of many SEOs is to have a website with 100% of pages that return a 200 status code, but we know that this is nearly impossible–and even less so when the website grows beyond a certain size.
But this doesn’t mean that we don’t have to keep this type of problem or codes other than 200 under control. Personally, I place a significant amount of weight on this type of work, since it’s a necessary step in maintaining a healthy website.
I concentrate particularly on soft 404s, which tend to be symptoms of thin content problems; Google is telling you directly that there’s poor content, and among the common 404 problems, this is generally due to human error or incorrect URLs in internal links, or to linked URLs that were then removed.
In Oncrawl, keeping these problems under control is rather easy, since you have a specific report covering these issues.
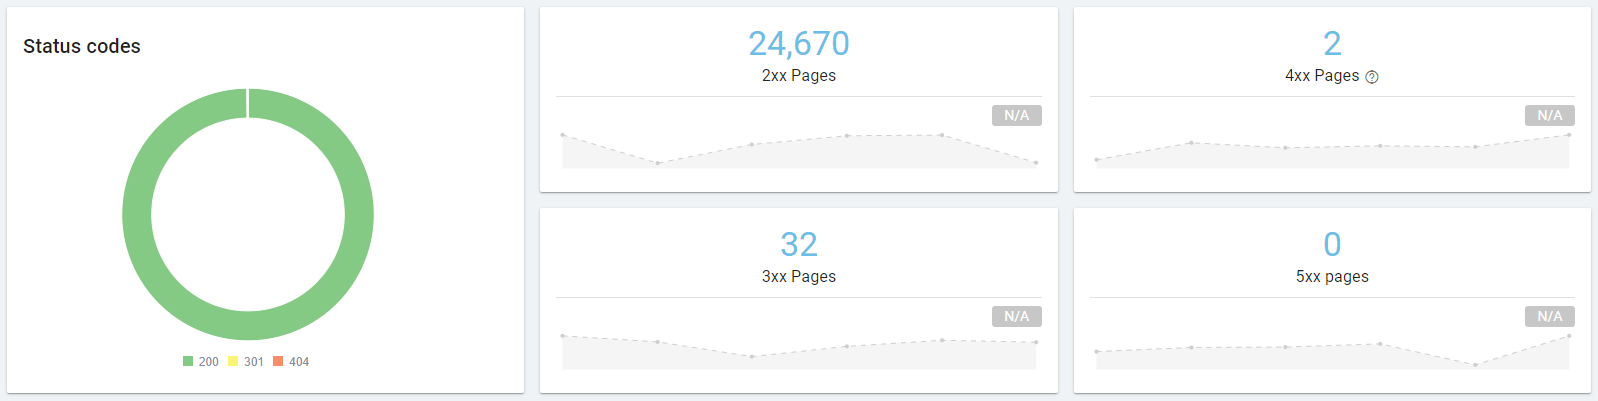
Part of the status code dashboard in Oncrawl
Finally, if you want to monitor 404 pages that appear in Analytics, you can consult this advanced guide by my colleague Eoghan Henn: https://www.searchviu.com/en/404-errors-google-analytics/
SEO Health Metrics for Content
In this section, we’ll concentrate on everything that has to do with users–and the answer to this is in content. We will also look at ranking changes and possible position changes, as well as visibility.
Evolving organic traffic
This is one of the main metrics that you should review frequently. Identifying why traffic has increased and the reasons for any drops is one of the key actions of an SEO.
Analytics will be an important ally here and you should have configured a weekly alert for increases or drops in traffic of more than 3-20%, depending on the size of your site.
Another way of tracking changes in organic traffic is through the performance report in the Search Console.
Advanced methods of identifying concrete problems include using segmentations for different types of URLs or sections of your site, separating desktop and mobile traffic, or relying directly on other monitoring metrics.
As we have said, the key points to watch are closely related to one another.
Oncrawl, in its Data Sources section, allows us to include data from Analytics and Search Console within the platform itself in order to visualize the data and cross-analyze it with Oncrawl’s crawl data. This allows us to draw clearer conclusions. The chart below allows us to prove an obvious correlation: duplicate content is the content type that receives the fewest visits.
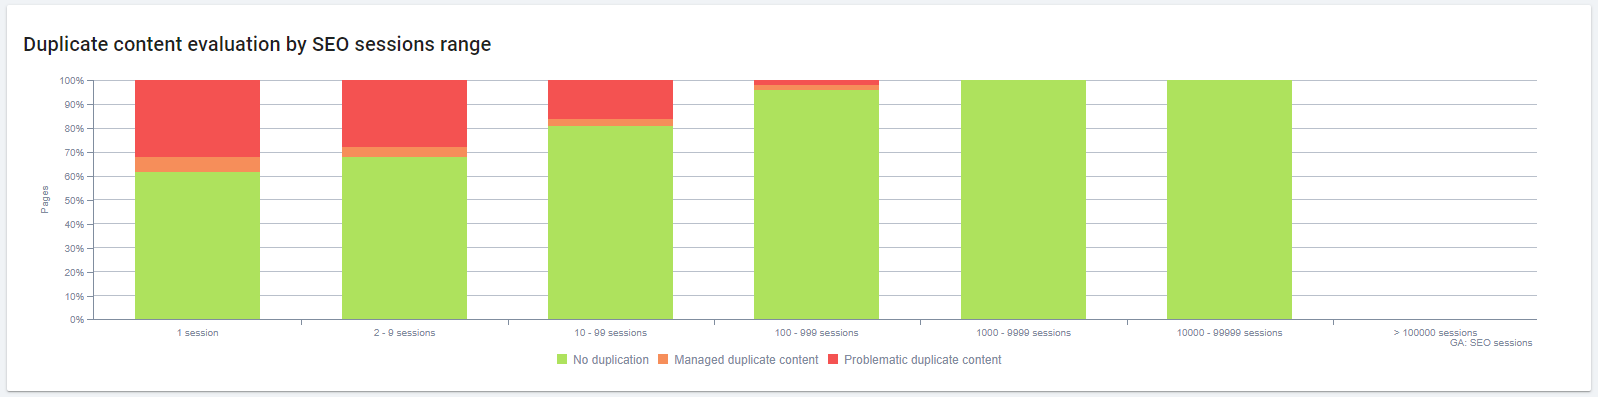
Looking at the impact of duplicate content on number of sessions with Oncrawl
Changes in user type
Users return rate can be a great indication that your users are invested in your website. Keep in mind that you will always have more new users than returning users, particularly in the beginning.
One way to see changes in this type of data is to program an alert in Analytics if the change from one week to another is significant, and to analyze what happened in order to cause the change.
SEO keyword monitoring
Keyword monitoring is a basic task. In spite of the influence of search intent, classifications still apply to keywords. When working with keywords, the best thing to do is to separate them into sections, URLs, or by type of traffic that they bring to the website, and then to examine changes over time.
If you lose positions or if you see something in your business that isn’t working, this will allow you to do a visual check per grouped ranking to figure out what is going on. Personally, AccuRanker is the tool that I use for associating principal keywords with URLs and grouping them using tags.
I also usually check the average position of monitored keywords for each tag.
Oncrawl’s Data Ingestion is another place where we can upload data to the platform to provide a broader view of keyword data in conjunction with the other data already available in the platform.
Report in Oncrawl’s Data Explorer displaying uploaded data, data from Google Search Console, and crawl data for a selected set of URLs
Bounce rate
Today, bounce rate is not an indicator of poor performance, but it can still allow us to detect problems such as poor user experience due to irrelevant content, or even poor alignment with search intent.
If we know the intent addressed by each URL, we can better interpret bounce rate data.
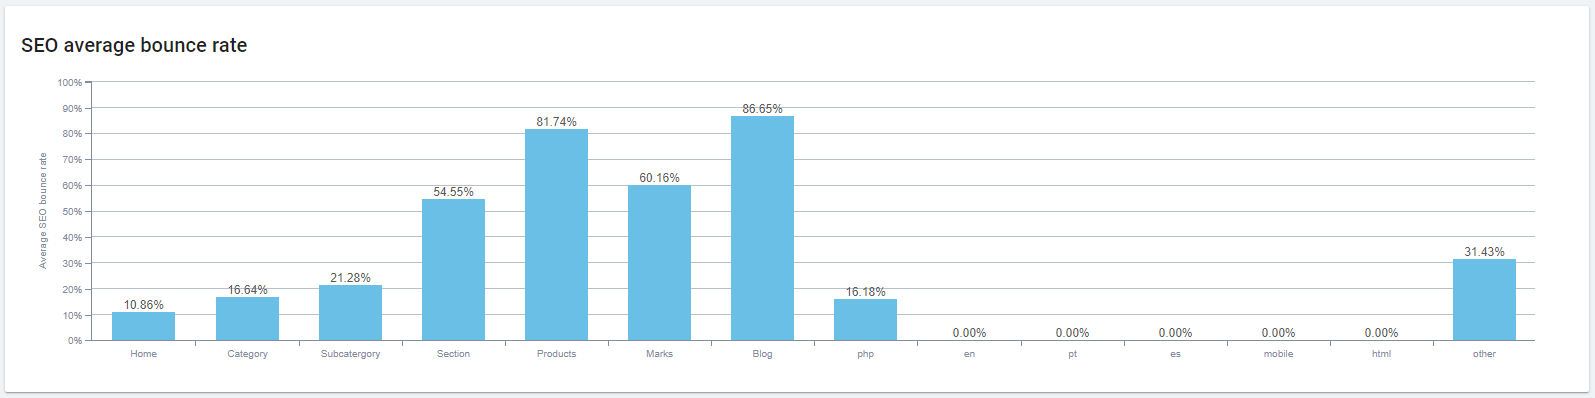
Bounce rates for each site section (Oncrawl)
In the chart above, we can see the bounce rate by type of URL, thanks to segmentations adapted to our website and easily created in Oncrawl.
SEO monitoring of Key Pages
The key pages on an ecommerce site is where the magic happens, or, in other words, they are the pages that a user visits before finalizing a purchase.
Within key page monitoring, you need to keep in mind different aspects, such as load time, bounce rate, or even exit rate if you have a defined funnel.
Here is where fields such as CRO come into play in order to improve key pages. However, as SEOs, we should keep an eye on key pages through reports on loss of users in the purchase funnel, cart abandon rate, or low product page performance.
Setting up alarms for when exits on pages you’ve defined as key are above average can help allow you to catch an anomaly in time, before it becomes a problem.
Pages that can be included in these key pages are those that bring the greatest benefits for categories or most frequently sold products, carts, checkouts, or the blog pages with the most traffic.
Revenue from organic traffic
This is somewhat obvious, since we’re working to earn revenue on our website. To do so, it’s essential to manage the organic channel of traffic acquisition.
Sales, signups, and changes over time are some of the things you should take into account. Additionally, you should understand the type of business that your website represents and the strategies used: seasonality and punctual actions tend to also have an impact on ROI.
Compare similar periods or compare one year to another in order to ensure the greatest objectivity.
Offsite and SEO brand metrics
The first two sections of this article concentrated on what can occur on your website. I want to use this last section to look at monitoring aspects that affect your website but that don’t depend directly on it.
Changes in direct traffic
Sometimes we concentrate on organic traffic, since we suppose that’s what we should be paying attention to as SEOs. But evaluating direct traffic allows us to go a little deeper and to see the status of the brand and its changes over time.
If you see drops in this traffic, look for correlations in organic traffic or from mobile devices in order to see if there’s an explanation.
Changes in referred traffic
Referred traffic is sometimes somewhat complicated to measure, since payment bridges can strip this data.
Ideally, you should set up an alert if referral traffic increases or drops more than 10%. This way, you can check whether or not you’ve lost an important link or if you’ve been linked to from an interesting location.
With the help of a tool like Ahrefs, you can investigate your backlink profile in more detail.
Changes in paid and email traffic
These are two types of traffic that are clearly not your responsibility as an SEO, but which can influence an ecommerce site. Set up alarms that will let you know if there have been significant drops from one week to another. This traffic can also influence organic traffic.
Branded keywords
You should always have an overview of this type of data, or at least have a view of how it changes over time, since it can indicate changes in brand recognition or whether specific campaigns are working better or worse than planned.
In the Search Console, it’s easy to see, but you also have different tools that offer more general data, such as Google Trends.
Finally, Oncrawl allows you, within the platform, to define your branded keywords in order to be able to filter any information panel or data visualization to data for your keywords.
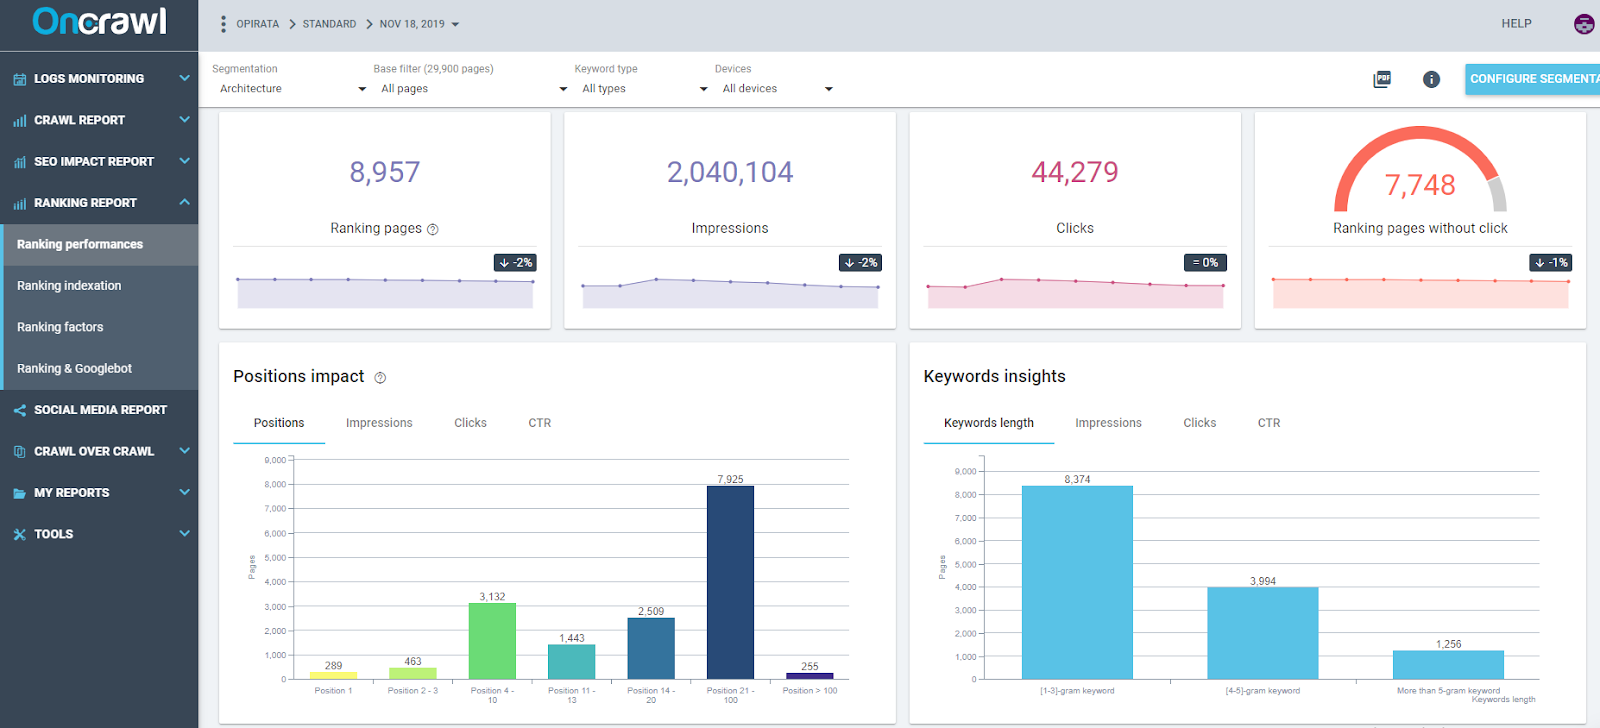
The Oncrawl “Ranking performances” dashboard shows data obtained by cross-analyzing crawl data and Search Console data
Impressions, clicks, and CTR for URLs
For these keywords, you’ll want to develop brand awareness associated with a few key terms. This can be visualized within Google Search Console.
A quick way of attacking the problem or the improvements in this area is to look at high numbers of impressions with a low CTR on the first page, or keywords with high search volume on page two in order to improve them.
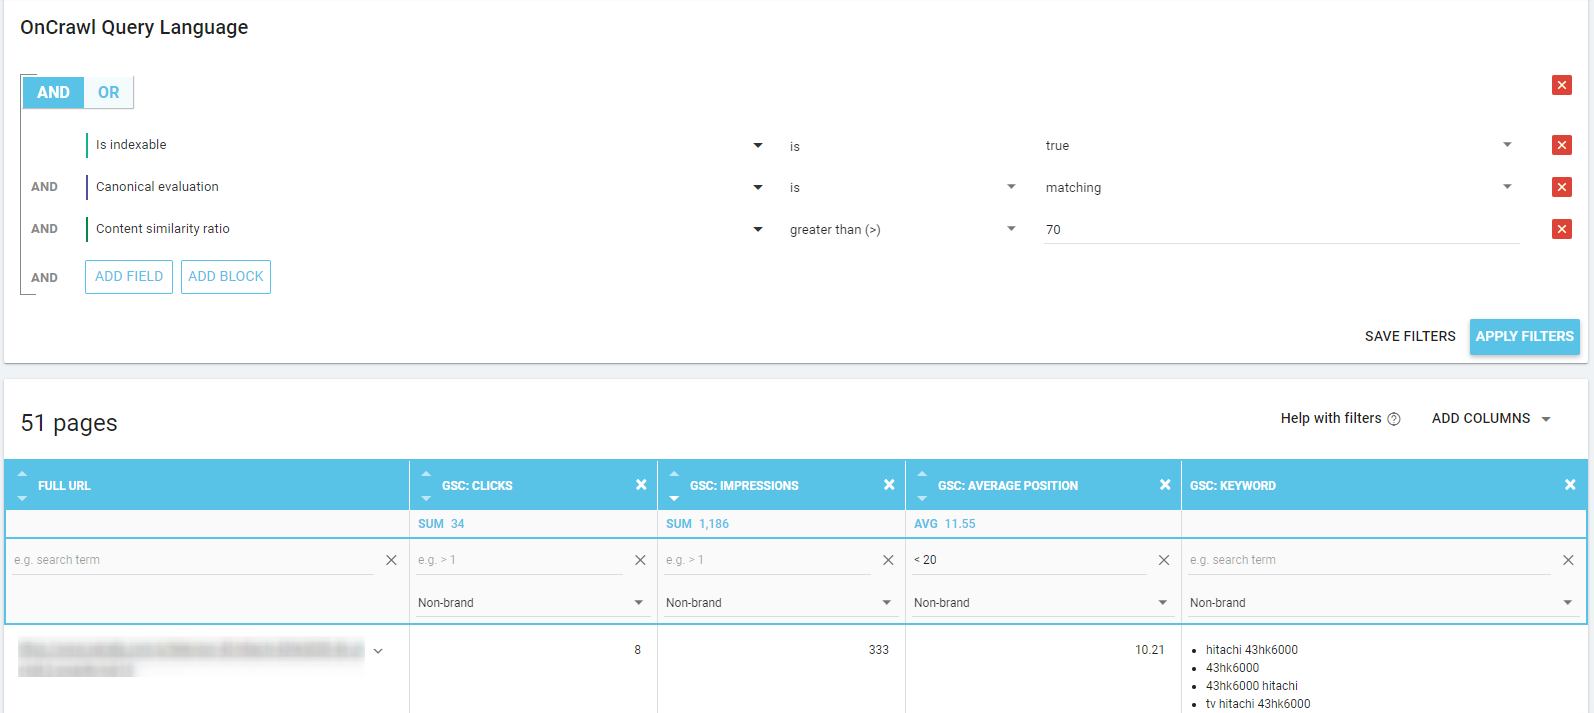
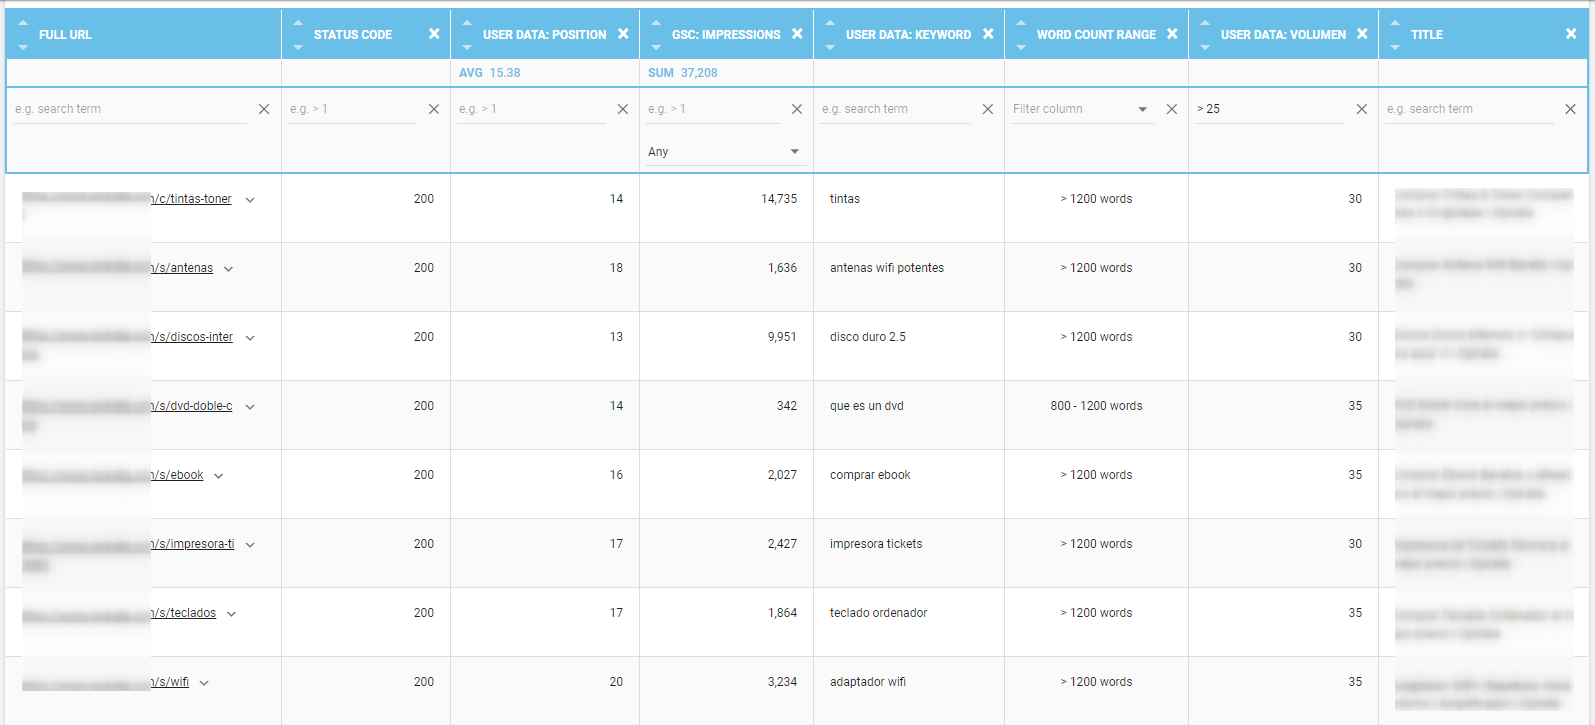
Using the Oncrawl Data Explorer to obtain a report of all pages that match certain criteria
In Oncrawl we can filter searches using the Data Explorer tool, and in the example above, limit our search to URLs that have a rate of similarity of 70%. This allows us to address a problem as we carry out optimization.
Other Metrics for Checking SEO Health
There are many other metrics to take into account for SEO on an Ecommerce site, such as the visibility index, the changes in backlinks earned, internal linking or signups on each webpage, but I believe that they are less important as direct influences on business health, or, in other cases, that they can’t be monitored in the types of ways we’ve listed above.
As we’ve seen, we rely on a majority of free tools, since these tools are fast and powerful enough to show us the web performance metrics we’re interested in.
Search Console helps to provide purely SEO data, as well as web performance data. Google Analytics allows us to contextualize these data within our business by showing business or user behavior metrics.
Additional tools, like Oncrawl, allow us to cross-analyze all of this data in a single tool, providing even better context in order to be able to gain a more precise understanding of problems viewed in a single location.