There’s one phrase that I try and live my (work) life by. It’s become somewhat of a mantra for me, especially working in content and creative. And it’s the following;
“Without data, you’re just another person with an opinion”
W. Edwards Deming
We’re in the age of data. Data is supposedly more valuable than gold, and we create data every time we interact with something. Which means there is no reason to not be using data when creating a strategy, even if it’s for something that we typically class as “creative” – like YouTube.
Creating a data-focused YouTube strategy is the key to achieving visibility and getting your content seen. But using data really has to be the foundation of what you do. It’s not good enough to go along after you’ve cooked the goose and try and shoehorn your keywords in.
If we look at studies into YouTube ranking factors – like this Backlinko one – we can see that classic “SEO optimisations”, such as optimising title tags and video descriptions, have little to no effect at all on rankings.
Instead, we need to focus on building our videos with data in mind. But what sort of data should we be looking to incorporate?
As I see it, there are three types of data that are important when creating content for YouTube.
| Data Type | What It Means | How We Get It | How We Use It | |
| Top-level keyword data | Topic + thematically relevant data | YouTube keyword research | Idea, title and summary | |
| Granular keyword data | LSI + long-tail keywords | Topic research + LSI generators | Script + video description | |
| Visual data | Objects, backdrops, actions, animation style, visuals | Video research |
|
Let’s break each of these types down a little further.
Finding great topics and effective titles with top-level keyword data
This data type is for your ideas, titles and video summaries.
In order to get this data, follow a process similar to any good keyword research process, but using a tool that can collect YouTube data for you. Ahrefs or keywordtool.io are good places to start.
Once you’ve collected all your keywords, you should (hopefully) be categorising them into larger themes for greater analysis. We do this also, but then to add greater context, we also overlay other metrics and plot everything as a bubble chart – like this:
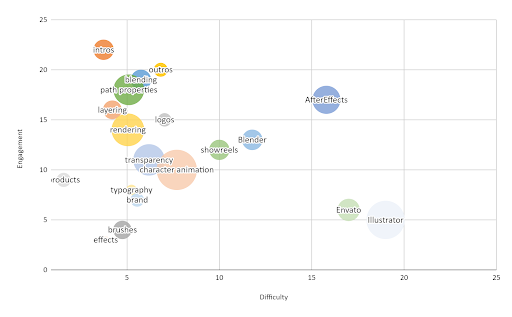
The three metrics we have plotted here are:
- Search volume – this is indicated by the size of the bubble. We get this from Ahrefs.
- Engagement – this is the average number of video views that videos for this keyword achieve.
- Difficulty – this is a custom script that tells us how hard it is to rank in this area.
Plotting the graph like this gives us clear areas to work in, and clear areas to avoid. It also goes down well with clients, which is always a nice bonus.
We start in the top left corner for quick wins, as these are categories with high engagement and low difficulty. Conversely, we avoid areas in the bottom right, as these are low engagement and high difficulty.
Collecting these metrics at scale can be quite time-consuming. We use our machine learning tool, Solomon, to do this for us – but it can be done by hand.
Once you’ve collected all the data and plotted the graph, it then becomes a simple task of drilling down into each category and looking at queries that are similar and can be grouped together in a single video. This should then feed into your video titles and summaries.
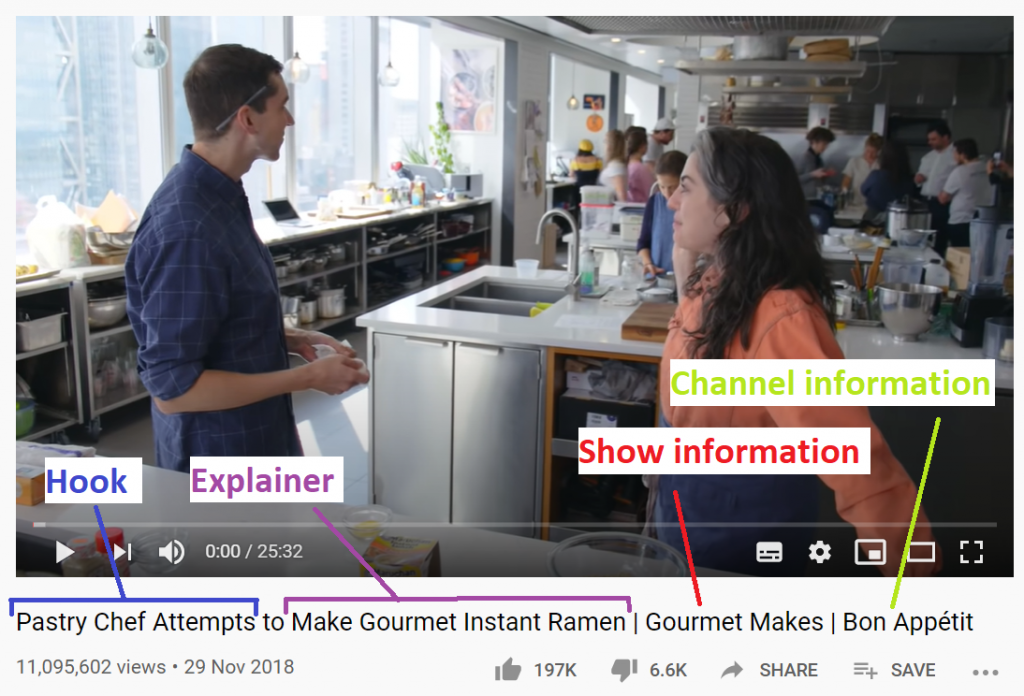
We are quite structured with how we integrate this data at Croud. When it comes to video titles, which is where we would normally use this type of data, we use the following structure.
The individual elements are :
- Hook – the Hook is what will be of interest to most people and allow you the most creative flair. Keep it short and punchy and, most importantly, keep it at the front. It’s the part of the title that is most likely to get it clicked and should also include the keywords you are aiming to rank for. There are five different types of hook we use across our titles.
- Explainer – The Explainer is like a tagline, or what comes after the colon in the title of a bad movie. It allows you to give a little more detail and slip in a few more keywords that are still of interest to the viewer.
- Show information – Show information is more for the search engines, but it can give important information to the user too, especially if you have multiple different shows on a single channel or an episodic structure to your storytelling.
- Channel information – As with show information, channel information is more for the search engines, but it can also be reassuring to the user. This is typically the brand name or brand channel name if there are multiple channels.
Using granular keyword data to create bulletproof scripts
This type of data is for your scripts and video descriptions.
When it comes to creating your scripts, you should really treat them like pieces of on-page copy and use whatever method you currently use to create well-optimised pieces of copy. There’s not really any need to reinvent the wheel here.
At Croud, we use the trusty SEMRush Writing Assistant plugin for Google Docs to create our scripts, and then review this against any keyword data we’ve collected, including any relevant LSI keywords.
However, one thing that I really want to stress here is the importance of a script. All videos need scripts, I cannot stress that enough. Even videos where your host goes a little off-piste (aka any video where I’m hosting!) need a script. This can be used as a jumping-off point for the video, but it is imperative that it is used so that you can be sure all your topics are being covered in enough detail, and that the appropriate keywords are being spoken about.
There’s a reason why this is very important. Similar to Google, we won’t really ever understand how the YouTube ranking algorithm works – but we can infer things from other Google properties. For example; the Google Cloud Speech product shows that Google has the technology to convert the speech from your video into text, which we know they can then analyse.
Does this mean that Google is looking for keywords in your script? Most likely. Which is why your script is so important, to ensure you’re covering topics in enough depth and detail to be able to rank well.
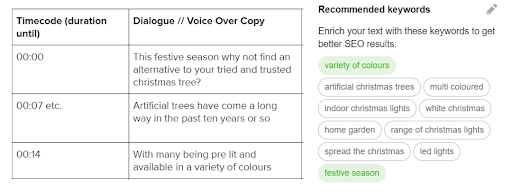
The other place you should be using this type of data is in your video descriptions. The optimum length for YouTube descriptions is between 300 – 350 words, and we use the below structure.
- Intro sentences – this should be 2-3 attention-grabbing sentences
- Detailed video description – 200 words to explain the video further
- CTA – any relevant call-to-actions, including further reading, resources etc.
- Links – links to social media profiles etc.
Creating storyboards for success with well-researched visual data
This type of data is for your storyboards (and creative briefs/business cases if needed!).
This is a step that is often overlooked but researching what common themes and elements the top videos in your category or niche have is incredibly important. To do this, you simply need to watch the videos and note down what you see.
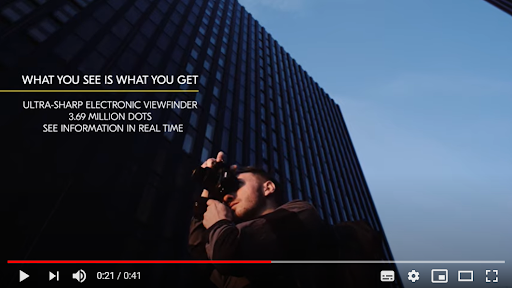
For example; in the above image we can see that there are four key objects present.
- Text – this explains the product benefits
- Product – this is in shot
- Hands – this indicates that the product is being used, which is important for technology products on YouTube
- Buildings – we can see that these are urban buildings.
You should go through as many videos as you can and start to research these themes and use them to build out your own video storyboards. This can be an incredibly time-intensive job, but there are ways to scale it.
One way that we have found to do this is to use the Google Video AI tool to analyse videos at scale. (That’s how they get you to buy their products!) The Google Video AI has machine learning models that automatically recognise objects, places, and actions in video.
This means that you can use it to check videos at scale and analyse the elements that are present. If you think Google can’t recognise basically every element of a video, you’re wrong. They can, and it’s incredibly creepy.
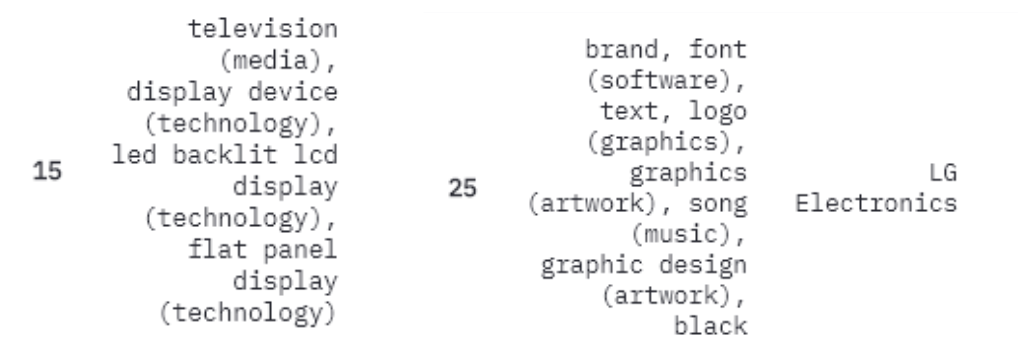
These are some of the objects the Video AI is able to identify in videos. Now imagine that it is doing this at scale, and applying these tags to your videos when deciding what to rank. See the importance of visual data now?
We run this data and aggregate the objects together to provide analysis and then construct our videos. For example; if we aggregate the data and see that both the ‘Hands’ object and text are on screen for a large percentage of the video, we know that the video is likely an explainer/product information video due to high screentime of both the ‘Hands’ object and text.
Once you’ve aggregated all this data together, use it to construct your storyboards or creative briefs, however, you work. But keep the data in mind. If The Algorithm is expecting to see the product on screen 80% of the time, you should aim to do that in your storyboards.
There is probably some argument to be had about “The Algorithm” deciding what we should include in our videos and limiting our creative freedom, but we, unfortunately, don’t have time to get into that today. However, what I will say is that this can be a double-edged sword, especially if you’re trying to wrangle some budget to fly your whole team to Hawaii to shoot on location.
In summary
So in summary, what have we learned? Well, you need to be data-first when trying to get maximum YouTube visibility. It’s not good enough to optimise your video tags after the video is completed, you need to build your video from the ground up using data.
Aim to collect, integrate and use the three types of data I’ve highlighted above and you can’t go wrong.