
The interest in what can be done on behalf of SEO with Python Libraries is no longer a secret. However, most people with little programming experience have difficulties in importing and using a large number of libraries or pushing, the results beyond what any ordinary crawler or SEO tool can do.
This is why a Python library created specifically for SEO, SEM, SMO, SERP check,and content analysis is useful for everyone.
In this article, we will take a look at a few of the things that can be done with the Advertools Python Library for SEO, created and developed by Elias Dabbas, and for which I see a big potential in SEO, PPC, and coding capabilities in a very short time. Also, we will use custom Python scripts along with other Python libraries in an educational and adaptive way.
We are going to examine what can be learned for SEO from a sitemap thanks to Elias Dabbas’s sitemap_to_df function which helps in downloading and analyzing XML sitemaps (A sitemap is a document in XML format used to report crawlable and indexable URLs to Search Engines.)
This article will show you how you can write custom Python codes for analyzing different websites according to their different structure, how to interpret data in terms of SEO, and how to think like a search engine when it comes to content profiles, URLs and site structures.
Analyzing a Website’s Content Scale and Strategy Based on its Sitemap
A sitemap is a component of a website that can capture many different types of data, such as how often a website publishes content, categories of content, publishing dates, author information, content subject…
Under normal conditions, you can scrape a sitemap with scrapy, convert it to a DataFrame with Pandas, and interpret it with many different auxiliary libraries if you want.
But in this article, we will only use Advertools and some Pandas library methods and attributes. Some libraries will be activated to visualize the data we have acquired.
Let’s dive right in and select a website to use its sitemap to conclude some important SEO insights.
Extracting and Creating Data Frames from Sitemaps with Advertools
In Advertools, you can discover, browse, and combine all sitemaps of a website with just one line of code.
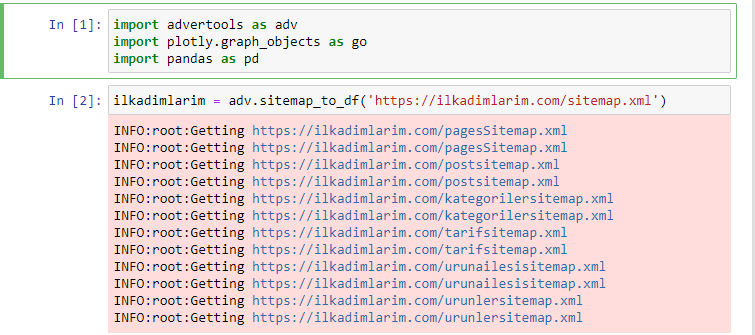
I love using Jupyter Notebook instead of a regular code editor or IDE.
In the first cell we have imported Pandas and Advertools for collecting and organizing data and Plotly.graph_objects for the visualizing data.
adv.sitemap_to_df(‘sitemap address’) command simply collects all sitemaps and unifies them as a DataFrame.
If you do the same using Pandas and Advertools, you can discover which URL is available in which sitemap.
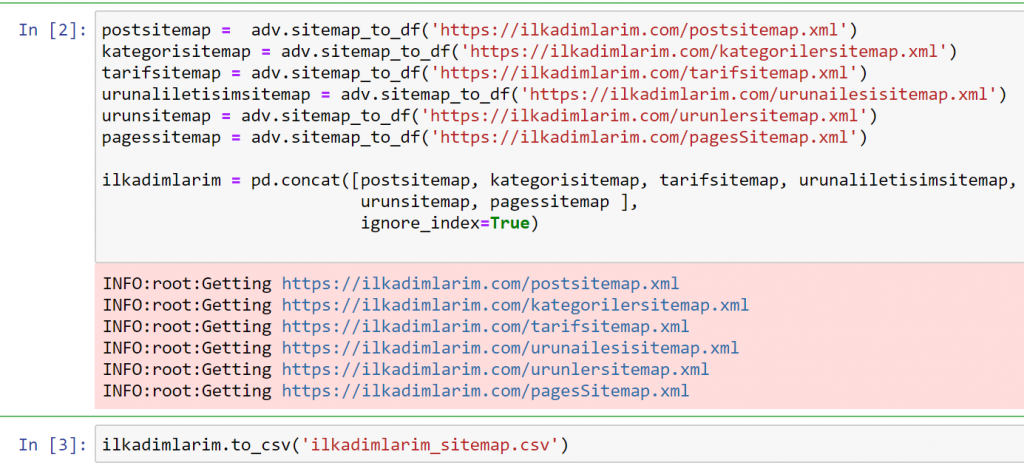
In the example above, we pulled the same sitemaps separately and then combined them with the pd.concat command and transferred the result to CSV. The previous example used the sitemap index file, in which case the function goes to retrieve all the other sitemaps. So you have the option of selecting specific sitemaps as we did here if you are interested in a particular section of the website.
You can see a column with different sitemap names above. ignore_index=True section is for the neat ordering of index numbers of different DataFrames, if you have merged multiple ones together.
Cleaning and Preparing the Sitemap Data Frame for Content Analysis with Python
To understand the content profile of a website through a sitemap, we need to prepare it in order to review the DataFrame we obtained with Advertools.
We will use some basic commands from the Pandas library to shape our data:
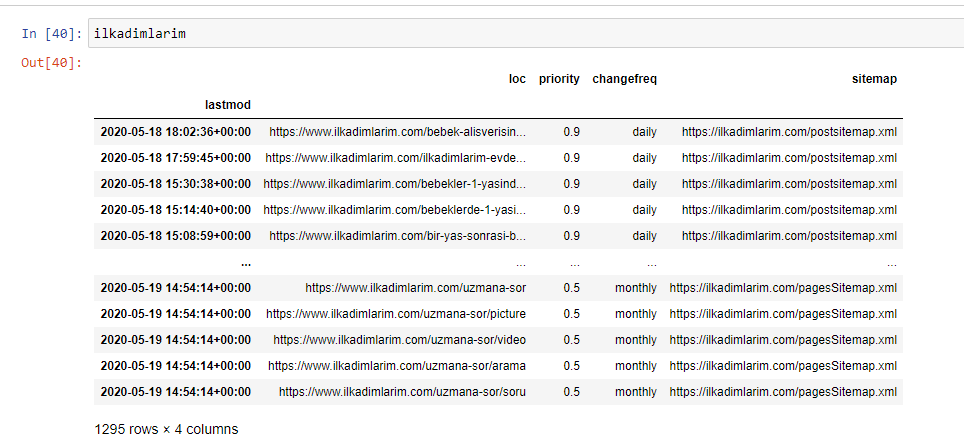
Ilkadimlarim = pd.read_csv(‘ilkadimlarim_sitemap.csv’)
ilkadimlarim = ilkadimlarim.drop(columns = ‘Unnamed: 0’)
ilkadimlarim[‘lastmod’] = pd.to_datetime(ilkadimlarim[‘lastmod’])
ilkadimlarim = ilkadimlarim.set_index(‘lastmod’)
“İlkadımlarım” means “my first steps” in Turkish, and as you can imagine, it’s a site for babies, pregnancy, and motherhood.
We have performed three operations with these lines.
- Unnamed: We removed an empty column named 0 from the DataFrame. Also, if you use ‘index = False “ with pd.to_csv() function, you won’t see this ‘Unnamed 0’ column at the beginning.
- We converted the data in the Last Modification column to Date Time.
- We brought the “lastmod” column to the index position.
Below you can see the final version of the DataFrame.
We know that Google doesn’t use priority and change frequency information from sitemaps. They call it “a bag of noise”. But if you give importance to the performance of your website for other search engines, you may find it useful to examine them too. Personally, I don’t care much about this data, but I still don’t need to remove it from the DataFrame.
We need one more code line for categorizing the sitemaps in another column.
ilkadimlarim[‘sitemap_cat’] = ilkadimlarim[‘sitemap’].str.split(‘/’).str[3]
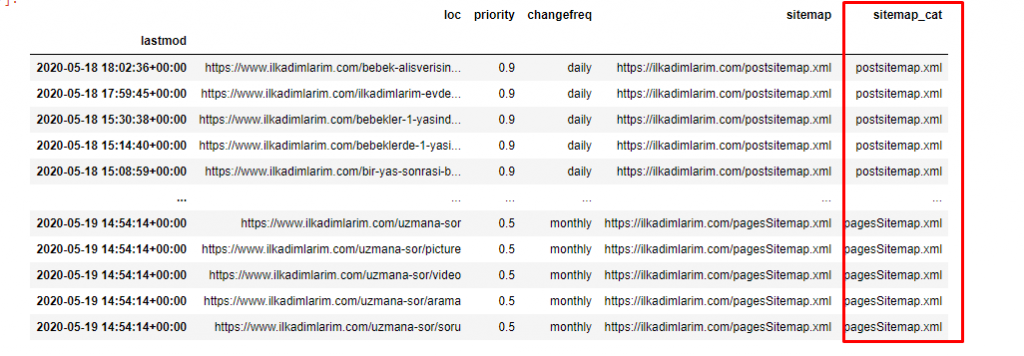
In Pandas, you may add new columns or rows to a DataFrame or you can update them easily. We have created a new column with DataFrame[‘new_columns’] code snippet. DataFrame[‘column_name’].str allows us to perform different operations by changing the type of data in a column. We divide the string data in the column related to .split (‘/’) by the / character and put it in a list. With .str [number], we create the contents of the new column by selecting a particular element in that list.
Content Profile Analysis according to Sitemap Count and Kinds
After putting the sitemaps in a different column according to their types, we can check what % of the contents are in each sitemap. Thus, we can also make an inference about which part of the website is more important.
ilkadimlarim[‘sitemap_cat’].value_counts(normalize = True) * 100
- DataFrame[‘column_name’] is selecting the column we want to make a process.
- value_counts() counts the frequency of values in the column.
- normalize=True takes the ratio of values in decimal.
- We make it easier to read by making the decimal numbers larger with *100.
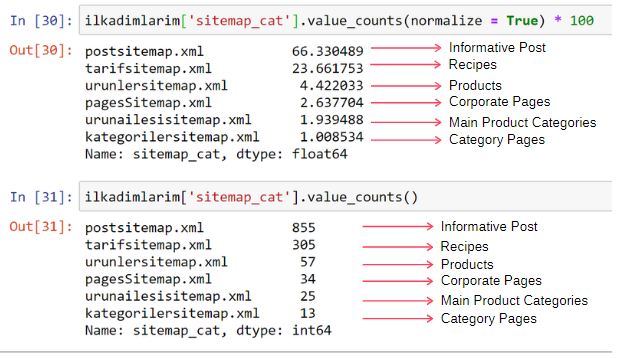
We see that 65% of the content is in the Post Sitemap and 23% is in the Recipe Sitemap. The Product Sitemap has only 2% of the content.
This shows that we have a website that has to create informative content for a wide audience to market its own products. Let’s check if our thesis is correct.
Before proceeding, we need to change ilkadimlarim[‘sitemap_cat’] column’s name to ‘URL_Count’ with the code below:
ilkadimlarim.rename(columns={‘sitemap_cat’ : ‘URL_Count’}, inplace=True)
- rename() function is useful to modify the name of your columns or indexes for connecting the data and its meaning on a deeper level.
- We have changed the column name to be permanent thanks to the ‘inplace=True’ attribute.
- You may also change your columns’ and indexes’ letter styles with ilkadimlarim.rename(str.capitalize, axis=’columns’, inplace=True). This writes only the first letters as capitalized of every column in İlkadimlarim.

Now, we may proceed.
To see this information in a single frame, you can use the code below:
(ilkadimlarim[‘sitemap_cat’]
.value_counts()
.to_frame()
.assign(percentage=lambda df: df[‘sitemap_cat’].div(df[‘sitemap_cat’].sum()))
.style.format(dict(sitemap_cat='{:,}’, percentage='{:.1%}’)))
- to_frame() is used to frame values measured by value_counts() in the selected column.
- assign() is used to add certain values to the frame.
- lambda refers to anonymous functions in Python.
- Here, the Lambda function and sitemap types are divided by the total sitemap number by Pandas div() method.
- style() determines how the final values specified are written.
- Here, we set how many digits are written after the period with the format() method.
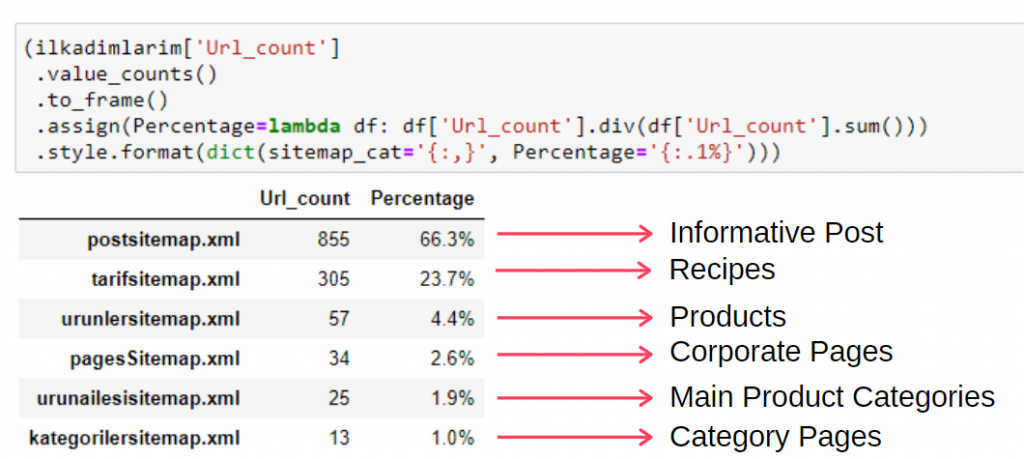
Thus, we see the importance of content marketing for this website. We can also check their article publishing trends by year with two single lines of code to examine their situation more deeply.
Examining and Visualizing Content Publishing Trends by Year via Sitemaps and Python
We did the content and intent matching of the examined website according to the sitemap categories, but we have not yet made a time-based classification. We will use the resample() method to accomplish this.
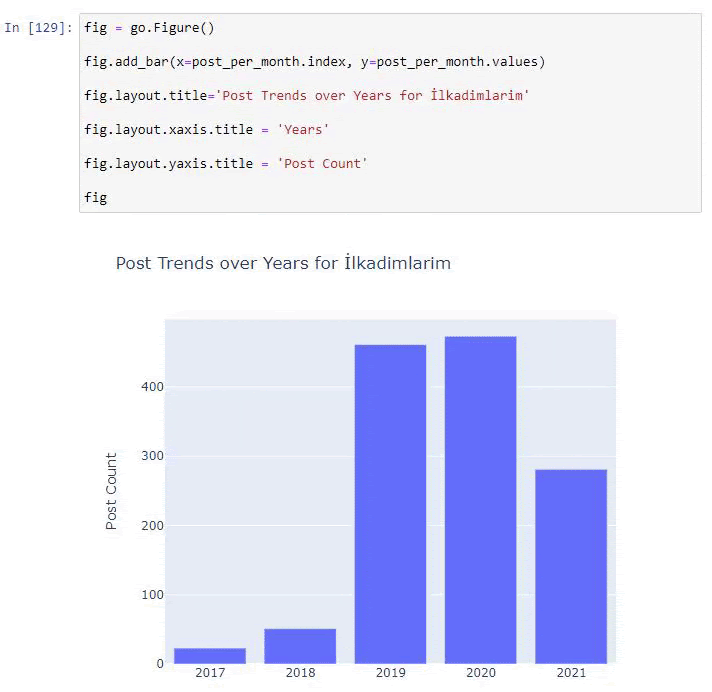
post_per_month = ilkadimlarim.resample(‘A’)[‘loc’].count()
post_per_month.to_frame()
Resample is a method in the Pandas library. resample(‘A’) checks the data series for an annual DataFrame. For weeks, you can use ‘W’, for months, you can use ‘M’.
Loc here symbolizes the index; count means that you want to count the sum of the data examples.
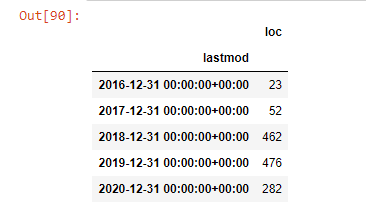
We see that they started to publish articles in 2016 but their main publishing trend has increased after 2017. We can also put this into a graphic with the help of Plotly Graph Objects.
Explanation of this Plotly Bar Plot code snippet:
- fig = go.Figure() is for creating a figure.
- fig.add_bar() is for adding a barplot into the figure. We also determine what X and Y axes will be within the parentheses.
- Fig.layout is for creating a general title for the figure and axes.
- At the last line we are calling the plot we have created with fig command which is equal to go.Figure()
Below, you will find the same data by month, with scatterplot and barplot:
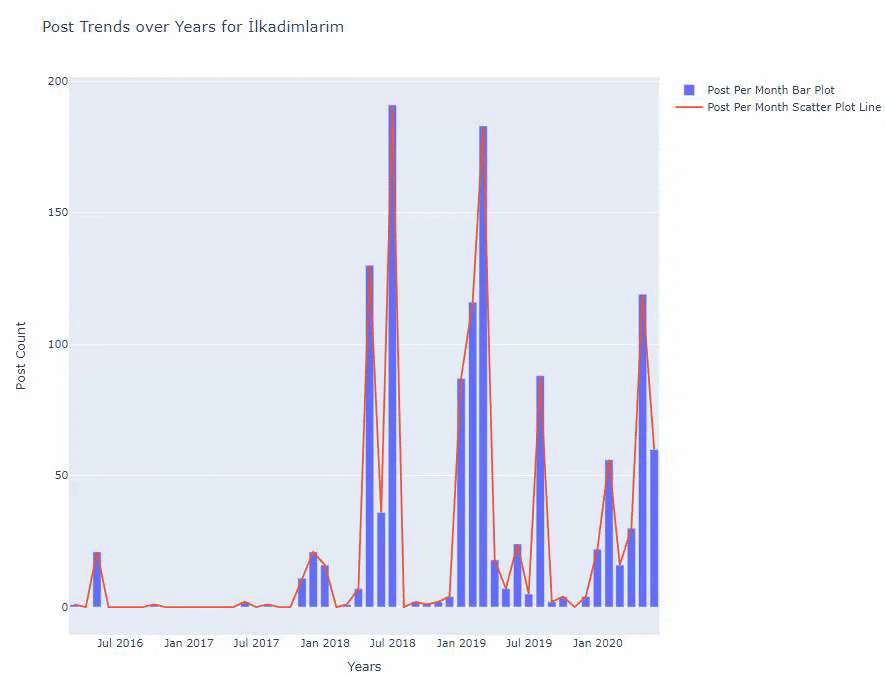
Here are the codes to create this figure:
We have added a second plot with fig.add_scatter(), and we have also changed the names using the name attribute. fig.update_layout() is for changing the size and background color of the plot.
You can also change the hover mode, the distance between bars, and more. I think it is sufficient to only share the codes, as explaining each code here separately may cause us to move away from the main subject.
We can also compare competitors’ content publishing trends according to categories like below:
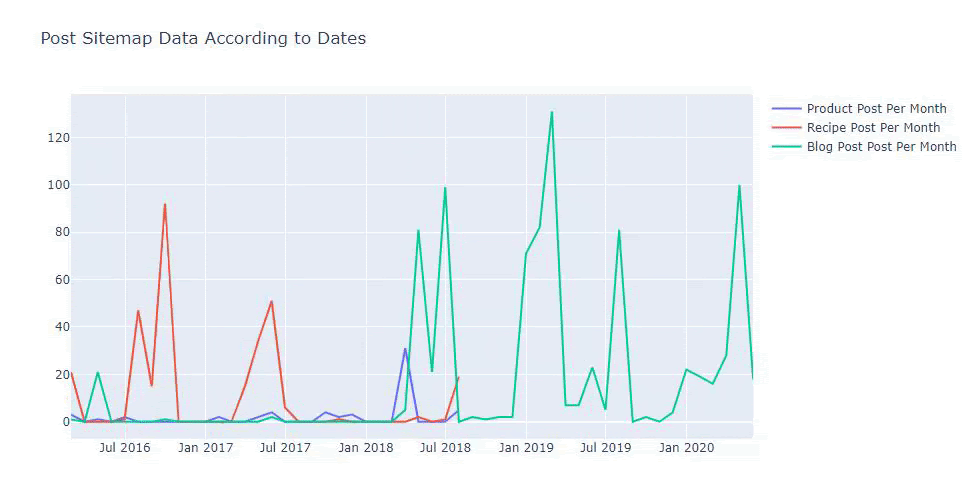
This chart has been created with the second method, as you may see there is no difference but one of them is quite simple.
In order to chart the frequency and trend of publishing content from three separate sitemaps, we must place the sitemap, which has the longest interval, on the X axis. Thus, we can compare the frequency with which the website we are examining publishes each different type of content for different search intents.
When you examine the relevant codes below, you will see that it is not much different from the above.
For creating a scatter plot with multiple Y axes, you may use the code below.
There are other methods such as unifying different sitemaps and using a for loop for the columns to use multiple Y Axis in scatter plot but for such a small site we don’t need that. For the most part, it would be more logical to use this method on websites with hundreds of sitemaps.
Also, because the website is small, the graphic might look shallow, but as you will see later in the article on a website with millions of URLs, such graphics are a great way to compare different sites as well as to compare different categories of the same website.
Examining and Visualizing Content Categories, Intent and Publishing Trends with Sitemaps and Python
In this section, we will check that they wrote a large number of content in a specific knowledge domain to market a small number of products, which we said at the beginning of the article. Thanks to this, we may see whether they have a content partnership with other brands or not.
To show what else can be found on sitemaps we will continue a little bit more digging. We can also get some information from the ‘loc’ part of the sitemap such as others.
There is no category breakdown in the URLs of İlkadımlarım. If a website has a category breakdown in its URLs, we can learn a lot more about content distribution. If not, we can access the same data by writing additional code, but only with less certainty.
At this point, you can imagine how much less costly URL breakdowns make it for search engines that crawl billions of sites to understand your website.
a = ilkadimlarim[‘loc’].str.contains(“bebek|hamile|haftalik”)
Bebek: baby
Hamile: pregnant
Haftalik: weekly or “weeks pregnant”
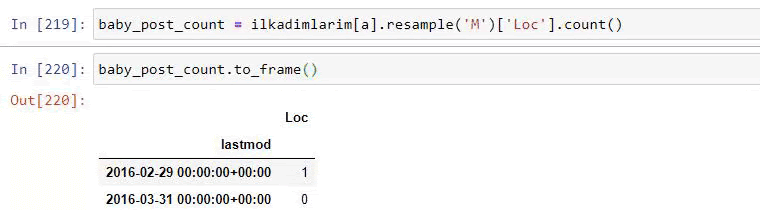
baby_post_count = ilkadimlarim[a].resample(‘M’)[‘loc’].count()
baby_post_count.to_frame()
The str() method here again allows us to set the column where we select certain operations.
With the contains() method, we determine the data to check whether it is included in the data converted to a string.
Here, “|” between the terms means “or”.
Then we assign the data we filtered to a variable and use the resample() method we used earlier.
count method, on the other hand, measures which data is used and how many times.
The result obtained with count() is again enclosed with the to_frame().
Also, str.contains() takes Regex values by default, which means that you may create more complicated filtering conditions with less code.
In other words, at this point, we assign the URLs containing the words “baby”, “weekly”, “pregnant” to a variable in ilkadimlarim, and then we put the publish date of the URLs in the appropriate conditions for this filter we created in a frame.
Then we do the same for URLs containing the word ‘aptamil’. Aptamil is the name of a baby nutrition product introduced by İlkadımlarım. Therefore, we can also pay attention to the broadcast density of informative and commercial content.
And you may see the two different content groups publishing schedules over years for different search intents with more certainty and precise information from URLs.
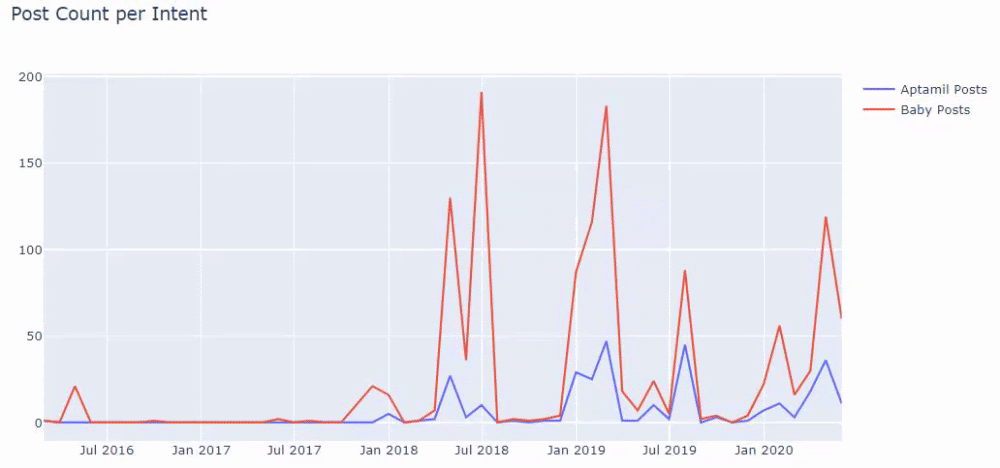
The code to produce this chart was not shared as it is the same as the one used for the previous chart
With the help of search operators on Google, I get 38 results when I want the pages where the word Aptamil is used in anchor text at İlkadimlarim.com. An important number of these pages are informative and they link commercial content.

Our thesis has been proven.
“My First Steps” uses hundreds of informative content pieces about motherhood, baby care and pregnancy to reach its target audience. “İlkadımlarım” links the pages containing Aptamil products from this content and directs the users there.
Comparative Content Profiling and Analysing Content Strategy via Sitemaps with Python
Now, if you want, let’s do the same for a company from the same industry and make a comparison to understand the general aspect of this industry and strategy differences between these two brands.
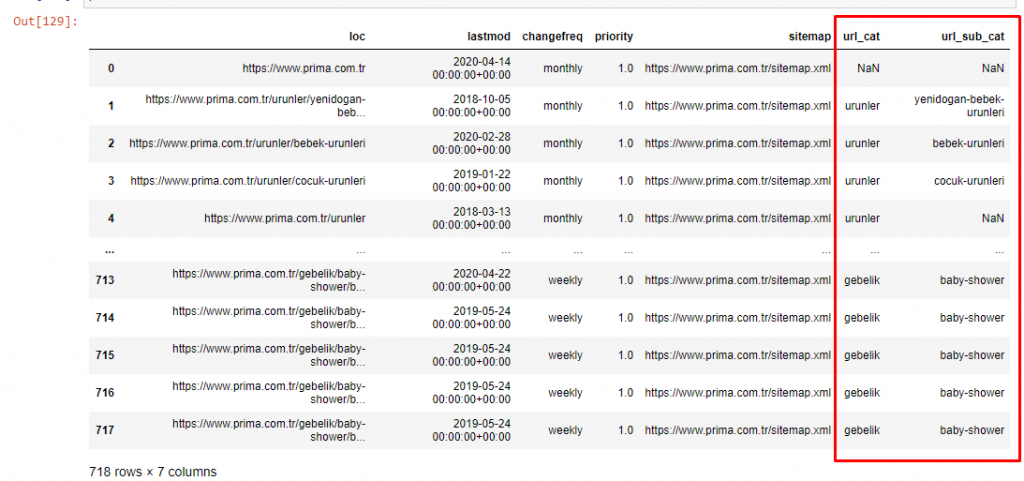
As a second example, I chose Prima.com.tr, which is Pampers, but uses the brand name Prima in Turkey. Since Prima has a single sitemap, we will not be able to classify by sitemaps, but at least they have different breaks in their URLs. So we are very lucky: we will have to write less code.
Imagine how much more more costly the algorithms that Google has to run for you are when you make a hard-to-understand site! This can help make, crawl cost calculation be more tangible in your mind, even just with respect to the URL structure.
In order not to increase the volume of the article further, we do not place the codes of the processes that are similar to those we have already done.
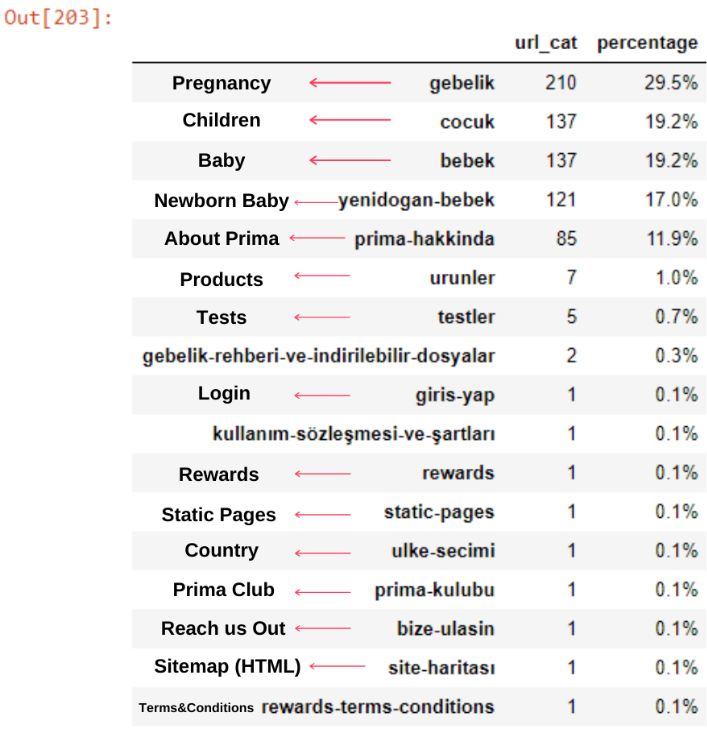
Now, we can examine their content category distribution by URL categories and URL subcategories. We see that they have an excessive amount of corporate web pages. These corporate web pages are placed in the “prima-hakkinda” (“About Prima”) section. But when I check them with Python, I see that they have unified their products and corporate web pages in one category. You can see their content distribution below:
We can do the same for the following subcategories.
It’s interesting to note that Prima uses “gebelik” (pregnancy in Turkish) which is a variant of “hamilelik” (pregnancy in Arabic), and both mean pregnancy period.
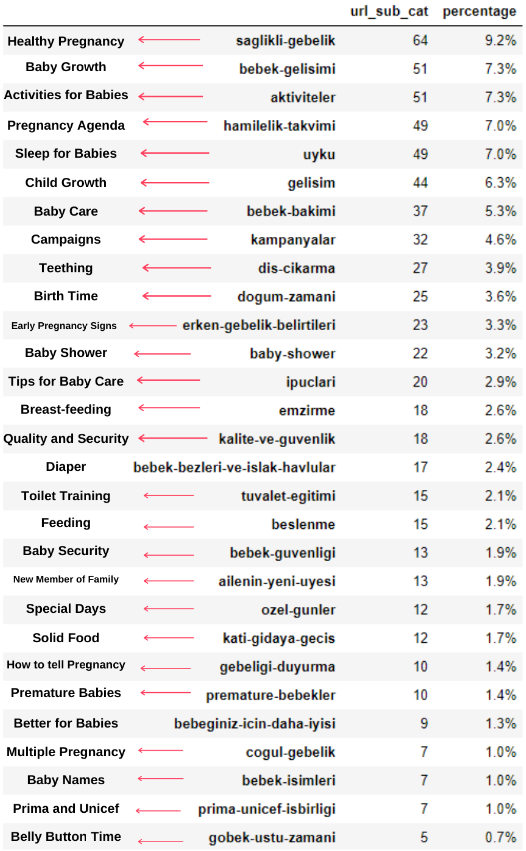
Now we see deeper categorization on their content. 9.2% of the content is about healthy pregnancy, 7.3% is about the growth process of babies, 8.3% of the content is about activities which can be done with babies, 0.7% is about the sleep order of babies. There are even topics like teething with 3.9%, baby security with 1.9%, and revealing a pregnancy to family with 1.4%. As you can see, you can get to know an industry with just URLs and their distribution percentage.
This is not the perfect categorization but at least we can see our competitors’ mindset and content marketing trends, and the content of their website according to categories. Now let’s check the frequency of publishing content by month.
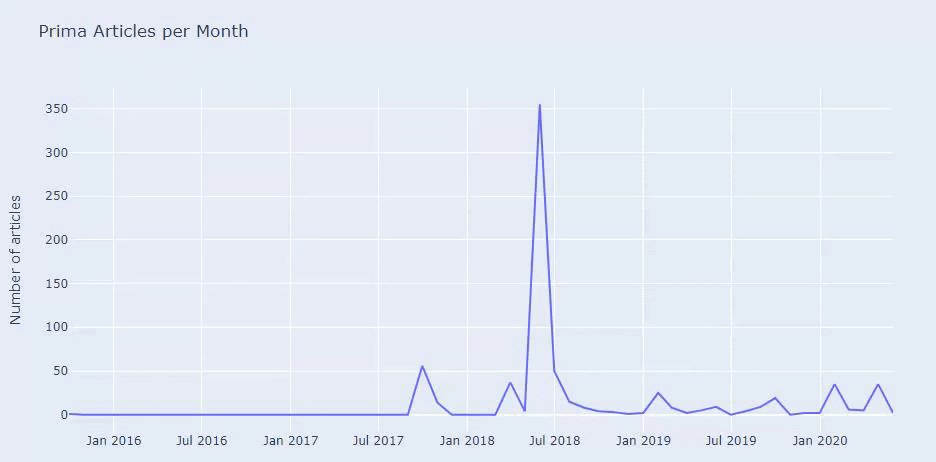
We see that they have published 355 articles in Jul 2018 and according to Sitemap, their contents are not refreshed since then. We can also compare their content publishing trends according to categories over the years. As you can see, their content is primarily located in four different categories and most of them are published in the same month.
Before proceeding, I must say that sitemap data may not always be correct. For example, the Lastmod data may have been updated for all URLs because they renewed all sitemaps on this date. To get around this, we can also check that they haven’t changed their content since then using the Wayback Machine.
Even if it looks suspicious, this data can be real. Many companies in Turkey have a tendency to give a high number of orders and publish content for a moment before. When I check their keyword count, I see a jump on this time period. So, if you are performing a comparative content profile and strategy analysis, you should also think about these issues.
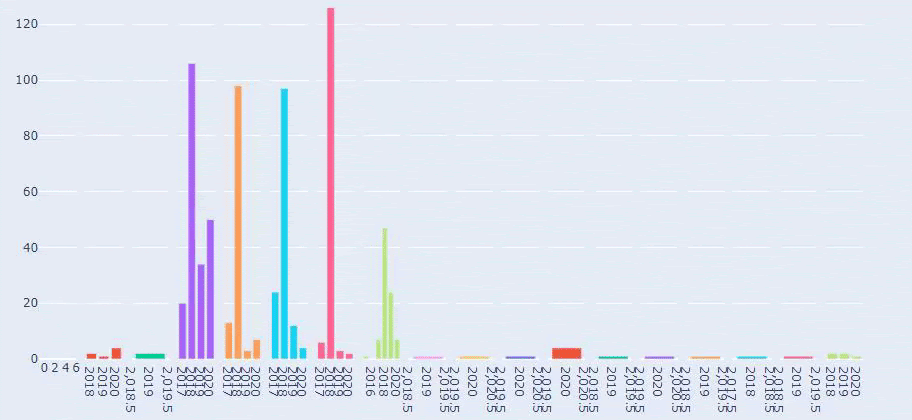
This is a comparison between every Categories’ Content Publishing Trend over Years for Prima.com.tr
Now, we can compare the two different websites’ content categories and their publishing trends.
When we look at Prima’s frequency of publishing articles about baby growth, pregnancy and motherhood, we see a similarity to İlkadımlarım:
- Most of the articles were published at a certain time.
- They had not been updated for a long time.
- The number of products and pages was very low compared to the number of informative content pages.
- Recently, they have just added new products to their sites.
We can consider these four features to be the industry’s default mindset and we may use these weaknesses in favor of our campaign. After all, quality demands freshness (as stated by Amit Singhal, Google Fellow).
At this point, we also see that the industry is not familiar with Googlebot’s behavior. Instead of uploading 250 content pieces in one day and then making no changes for a year, it is better to periodically add new content and update the old content regularly. Thus, you can maintain the quality of the content, Googlebot can understand your site more easily, and your crawl demand frequency values will be higher than your competitors.
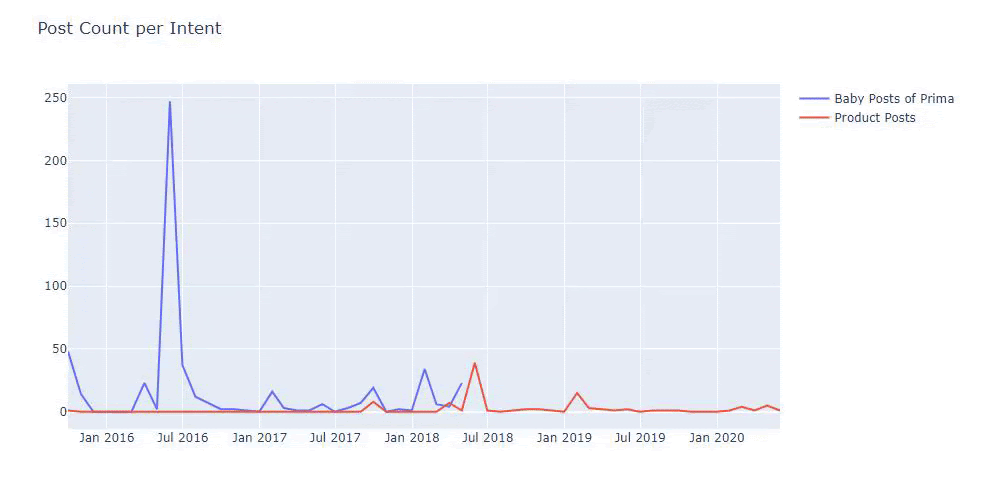
I used the previous methods to distinguish between product and informative content pages and profiled the most used words in the URLs. Baby Posts here means that these are informative content.
As you may see, they have added 247 content on one day. Also, they didn’t publish or refresh informative content in over one year, and they just occasionally add some new product pages.
Now let’s compare their publishing trends in a single figure but with two different plots. I have used the codes below for creating this figure:
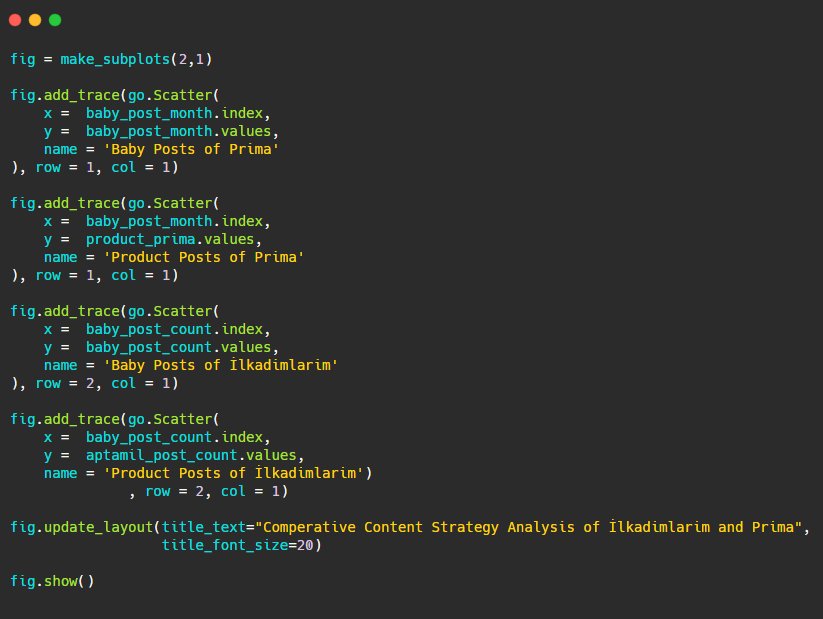
Since this graphic is different from the previous ones, I wanted to show you the code. Here, two separate plots are placed in the same figure. For this, the make_subplots method was called with the command from plotly.subplots import make_subplots.
It was created as a two-row and one-column figure with make_subplots (2,1).
Therefore, col and row are written at the end of the traces and their positions are specified. It is a system that anyone familiar with the grid system in CSS can easily recognize.
If you have a customer in the same sector, you may use this data to create a content strategy, to see your competitors’ weaknesses and their query/landing page network over SERP. Also, you can understand what amount of content you should publish in the same knowledge domain or for the same user intent.
Before wrapping up with what we can learn from sitemaps as part of a content strategy analysis, we can examine one last website with a much higher URL count from another industry.
Content Strategy Analysis of News Web Entities over Currencies with Python and Sitemaps
In this section we will use Seaborn’s heatmap plot and also some fancier framing and data extracting methods.

Elias Dabbas has an interesting and really useful Kaggle Archive in terms of Data Science and SEO. This month, he has opened a new Kaggle Dataset Section for Turkish News Sites for me to write the necessary codes and perform a content strategy analysis with Advertools via sitemaps.
Before I start to use these techniques on Kaggle, I’d like to show some examples of what would happen if we would use the same techniques on bigger web entities in this article.
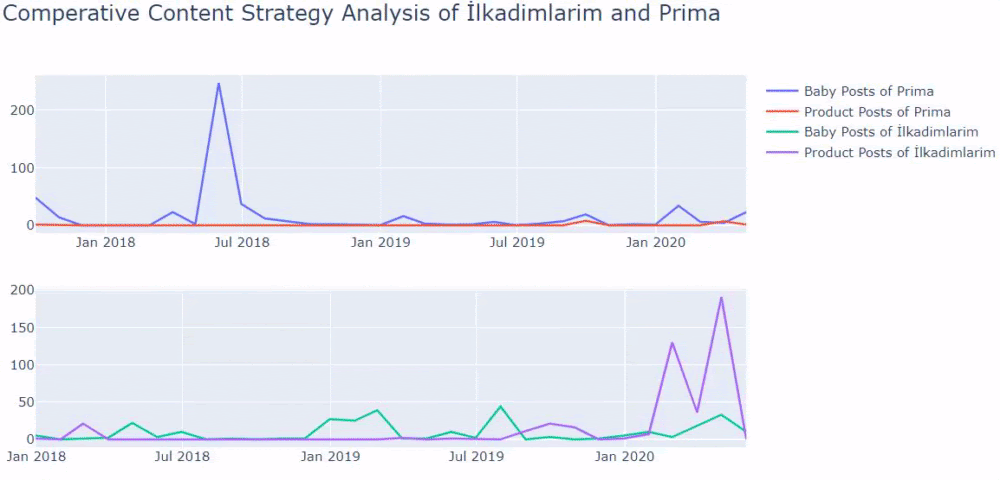
When we analyze the content of Sabah Newspaper, we see that a significant part of its contents (81%) is in a category called “apara”. Also, they have some big categories for Astrology, Calculation, Dictionary, Weather, and World news. (Para means the money in Turkish)
For Sabah Newspaper, we can also analyze content with sitemaps we have collected only with Advertools, but since the newspaper in question is very large, I did not prefer it because of the high number of sitemaps and the content of different sitemaps containing the same URL Category.
Below you can also see the excess of sitemaps with Advertools.
We may see that they have different sitemaps for the same URL Categories such as Gold, Credit, Currencies, Tags, Pray Times and Pharmacy Working Hours, etc…
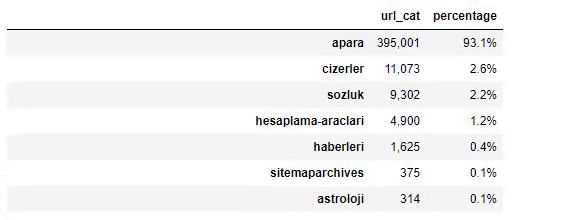
In short, we can achieve these details by focusing on subcategories of URLs. Instead of unifying different sitemaps via variables. So, I have unified all of the sitemaps with Advertools’ sitemap_to_df() method like at the beginning of the article.
We can also use another set of functions created by Elias Dabbas to create better data frames. If you check the dataset_utitilites functions, you can see some examples. The code below gives the total and percentage of a specified URL regex along with cumulative sum by stylizing.
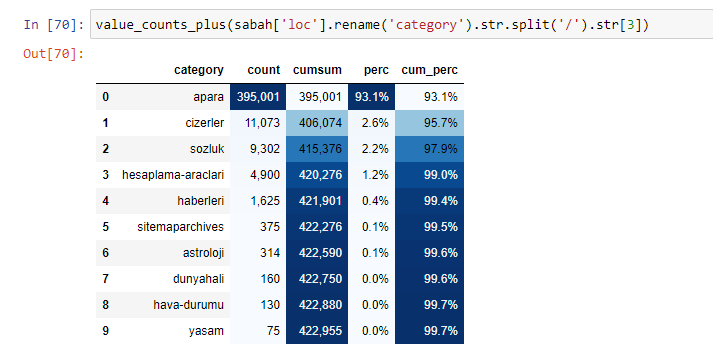
If we do the same to a sub-URL breakdown of Sabah Newspaper, we will get the following result.
You can increase the number of lines that the function in question will output by changing the line below. Also, if you examine the function’s content, you will see that it is similar to the ones we have used before.
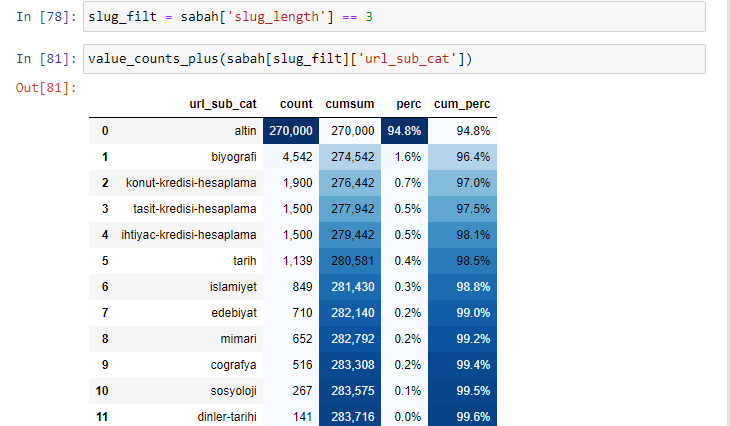
In sub-breakings, we see different breakdowns such as “Religion History”, “Biography”, “City Names”, “Football”, “Bizimcity (Caricature)”, “Mortgage Credit”. The biggest breakdown is in the “Gold” category.
So how can a newspaper have 295,000 URLs for Gold Prices?
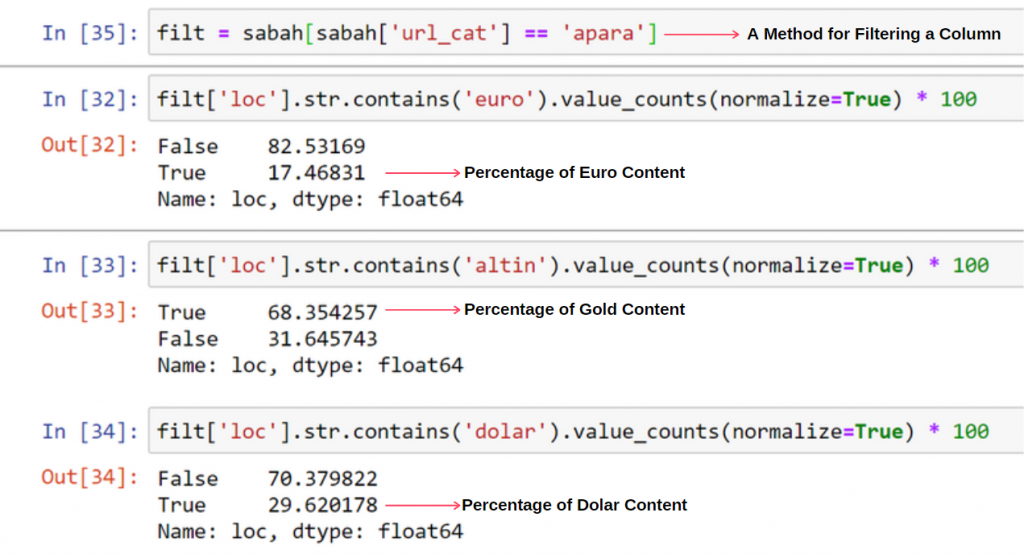
First of all, I throw all the URLs that contain the “apara” in the first URL breakdown of Sabah Newspaper into a variable.
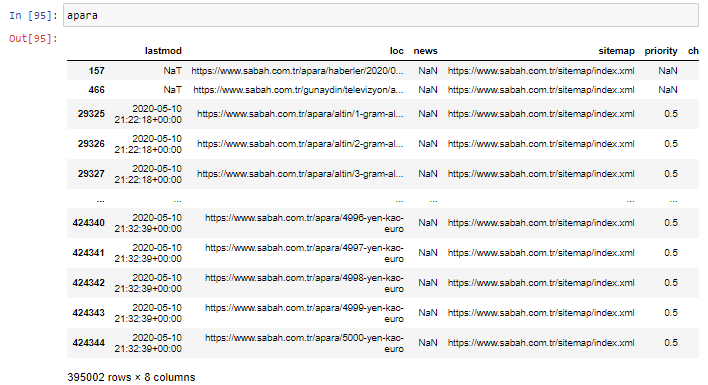
apara = sabah[sabah[‘loc’].str.contains(‘apara’)]
Here is the result:
We can also filter the columns with .filter() method:
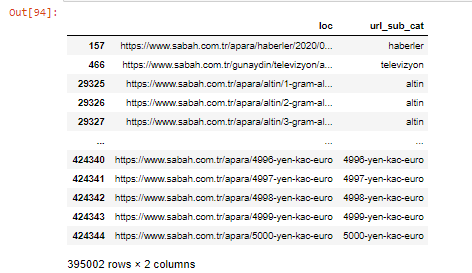
Now, we can see at the bottom of the DataFrame why Sabah Newspaper has an excessive amount of Apara URLs because they have opened different web pages for every amount of currency calculation such as 5000 Euros, 4999 Euros, 4998 Euros and more…
But, before any conclusion, we need to be sure because more than 250,000 of these URLs belong to the ‘altin (gold)’ category.
apara.filter([‘loc’, ‘url_sub_cat’ ]).tail(60) will show us last 60 lines of this Data Frame:
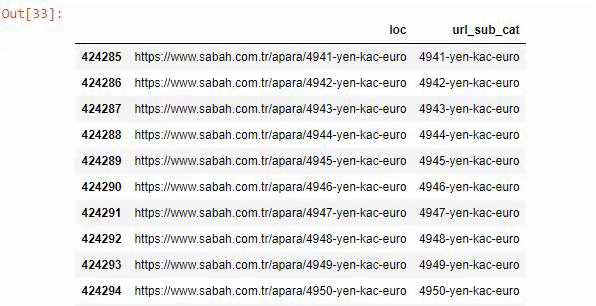
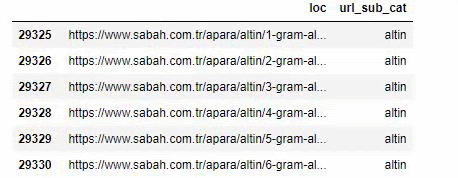
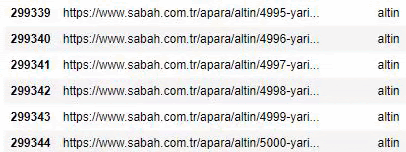
We can do the same for the gold URL breakdown within the Apara group.
gold = apara[apara[‘loc’].str.contains(‘altin’)]
gold.filter([‘loc’,’url_sub_cat’]).tail(85)
gold.filter([‘loc’,’url_sub_cat’]).head(85)
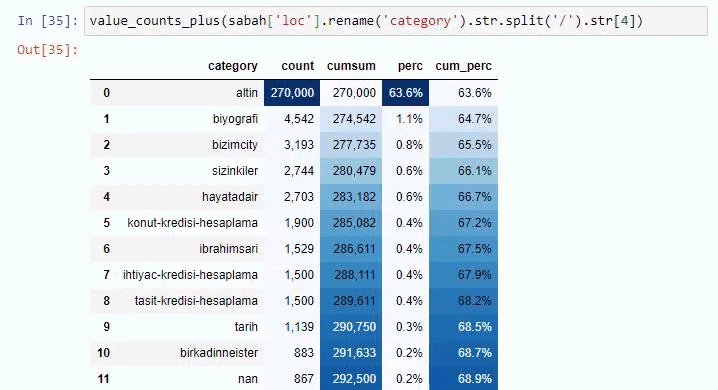
At this point, we see that Sabah Newspaper has opened 5000 different pages to convert each currency into Dollar, Euro, Gold, and TL (Turkish Liras). There is a separate calculation page for each unit of money between 1 and 5000. You can see the example of the first 85 and last 85 lines of the gold group below. A separate page has been opened for each gram of gold price.
We have no doubt that these pages are unnecessary, with lots of duplicate content, and excessively large, but Sabah Newspaper is such a brand-strong website that Google continues to show it in almost every query, top ranking.
At this point, we can also see that Crawl Cost Tolerance is high for an old news site with high authority.
However, this does not explain why the gold category has more URLs than others.
I don’t see anything strange about overlapping values adding up to more than 100%.
Unless I’m missing something?
As you will notice, when we add all the True Values, we get the result of 115.16%. The reason for this is below.

Even the main group has an intersection with each other like this. We could also analyze these intersections, but it could be the subject of another article.
We see that 68% of the contents in the Apara URL group are related to GOLD.
To better understand this situation, the first thing we need to do is to scan the URLs in the gold refraction.
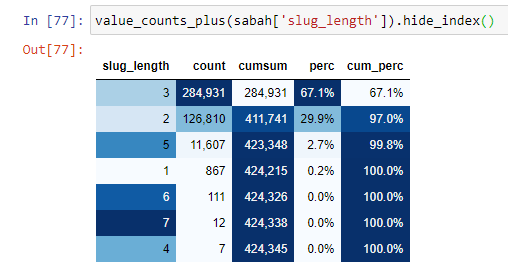
When we classify the URLs according to the amount of ‘/’ they have since the root section, we see that the number of URLs with a maximum of 3 breaks is high. When we analyze these URLs, we see that 270.000 of the 3 slug_length URLs are in the Gold category.
morning_filt = morning [‘slug_length’] == 3 It means that you only get the ones that are equal to 3 from the data group of int data type in a certain column of a certain data frame. Then, based on this information, we frame the URLs which are convenient to the condition with the count, sums, and aggregation rates with cumulative sum.
When we extract the most commonly used words in the gold URLs, we come across words that represent “full”, “republic”, “quarter”, “gram”, “half”, “ancestor”. Ata and Republic gold types are unique for Turkey. One of them is representing Turkish Sovereignty and the other one is the Founder of the Republic, Kemal Ataturk. That’s why their query search volumes are high.
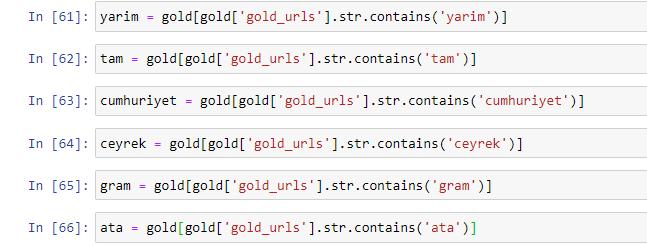
First of all, we have removed the common words found in the URLs and assigned them to separate variables. Next, we will use these variables in the Gold DataFrame to create columns specific to their types.
After creating new columns through variables, we must filter them together with boolean values.
As you can see, we were able to categorize all gold URLs with 270,000 rows and 6 columns. The main reason for the high number of gold-specific pages is that the Dollar or the Euro have no separate types, while the gold has separate types. At the same time, the diversity of crossing pages between gold and different currencies is higher than other currencies due to their traditional trust in Turkish people.
In my opinion, all types of gold pages should be equally distributed, right?
We can easily test this with Seaborn’s Heatmap feature.
import seaborn as sns
import matplotlib.pyplot as plt
plt.figure(figsize=(10,8))
sns.heatmap(a,yticklabels=False,cbar=False,cmap=”viridis”)
plt.show()
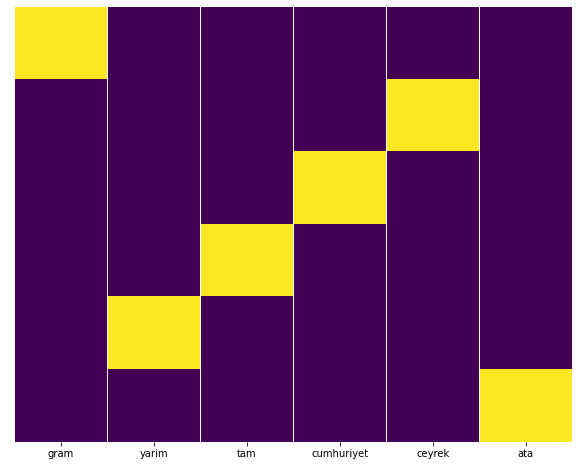
Here on the Heat Map, the Trues in each column are simply marked. As can be seen, the size of each is symmetrical with each other and is neatly arranged on the map.
Thus, we have taken a broad perspective on the content policy of Sabah.com.tr Newspaper about Currencies and Currency Calculation.
In the future, I will be writing Turkish News Websites and their content strategies based on Sitemaps Kaggle, which was launched by Elias Dabbas, but in this article, we’ve talked enough about what can be discovered on both large and small websites with sitemaps.
Conclusion and Takeaways
I think we’ve seen how easy it is to understand a website, thanks to a smooth and semantic URL structure. We should also remember how valuable a proper URL structure can be for Google.
In the future, we will see lots of SEOs who are increasingly familiar with data science, data visualization, front-end programming, and more… I see this process as a beginning of inevitable change: the gap between SEOs and developers will be closed completely in a few years.
With Python, you can take this sort of analysis even further: it is possible to get data from understanding the political views of a news site, to who writes about what, how often and with what feelings. I prefer not to go into that here as these processes are more about pure data science than SEO (and this article is already pretty long).
But if you’re interested, there are many other types of audits that can be performed via Sitemaps and Python, such as checking the status codes of URLs in a sitemap.
I’m looking forward to experimenting and sharing other SEO tasks you can do with Python and Advertools.