We are pleased to announce that we have just released a new feature that is going to ease your SEO journey, the Custom Dashboards. We are always working on improving our user’s experience and this new feature will help you create effective and powerful SEO reports from scratch and with the data that matter to you.
What are the Custom Dashboards?
Our brand new Custom Dashboard feature is the improved version of our former Viz Explorer. Meaning you can create custom reports with the data, segmentations and views you need to build your very own dashboards. Made for SEO agencies but also in-house teams, the Custom Dashboard is your best friend when it comes to build customized SEO reports. You can create specific reports for your SEO audits and find in one glance all the data you need.
Based on a drag&drop interface, you can add, remove, replace and modify any graph belonging to your projects.
Available on all plans and for every users, the Custom Dashboard is a user-friendly and ease-to-use time saver.
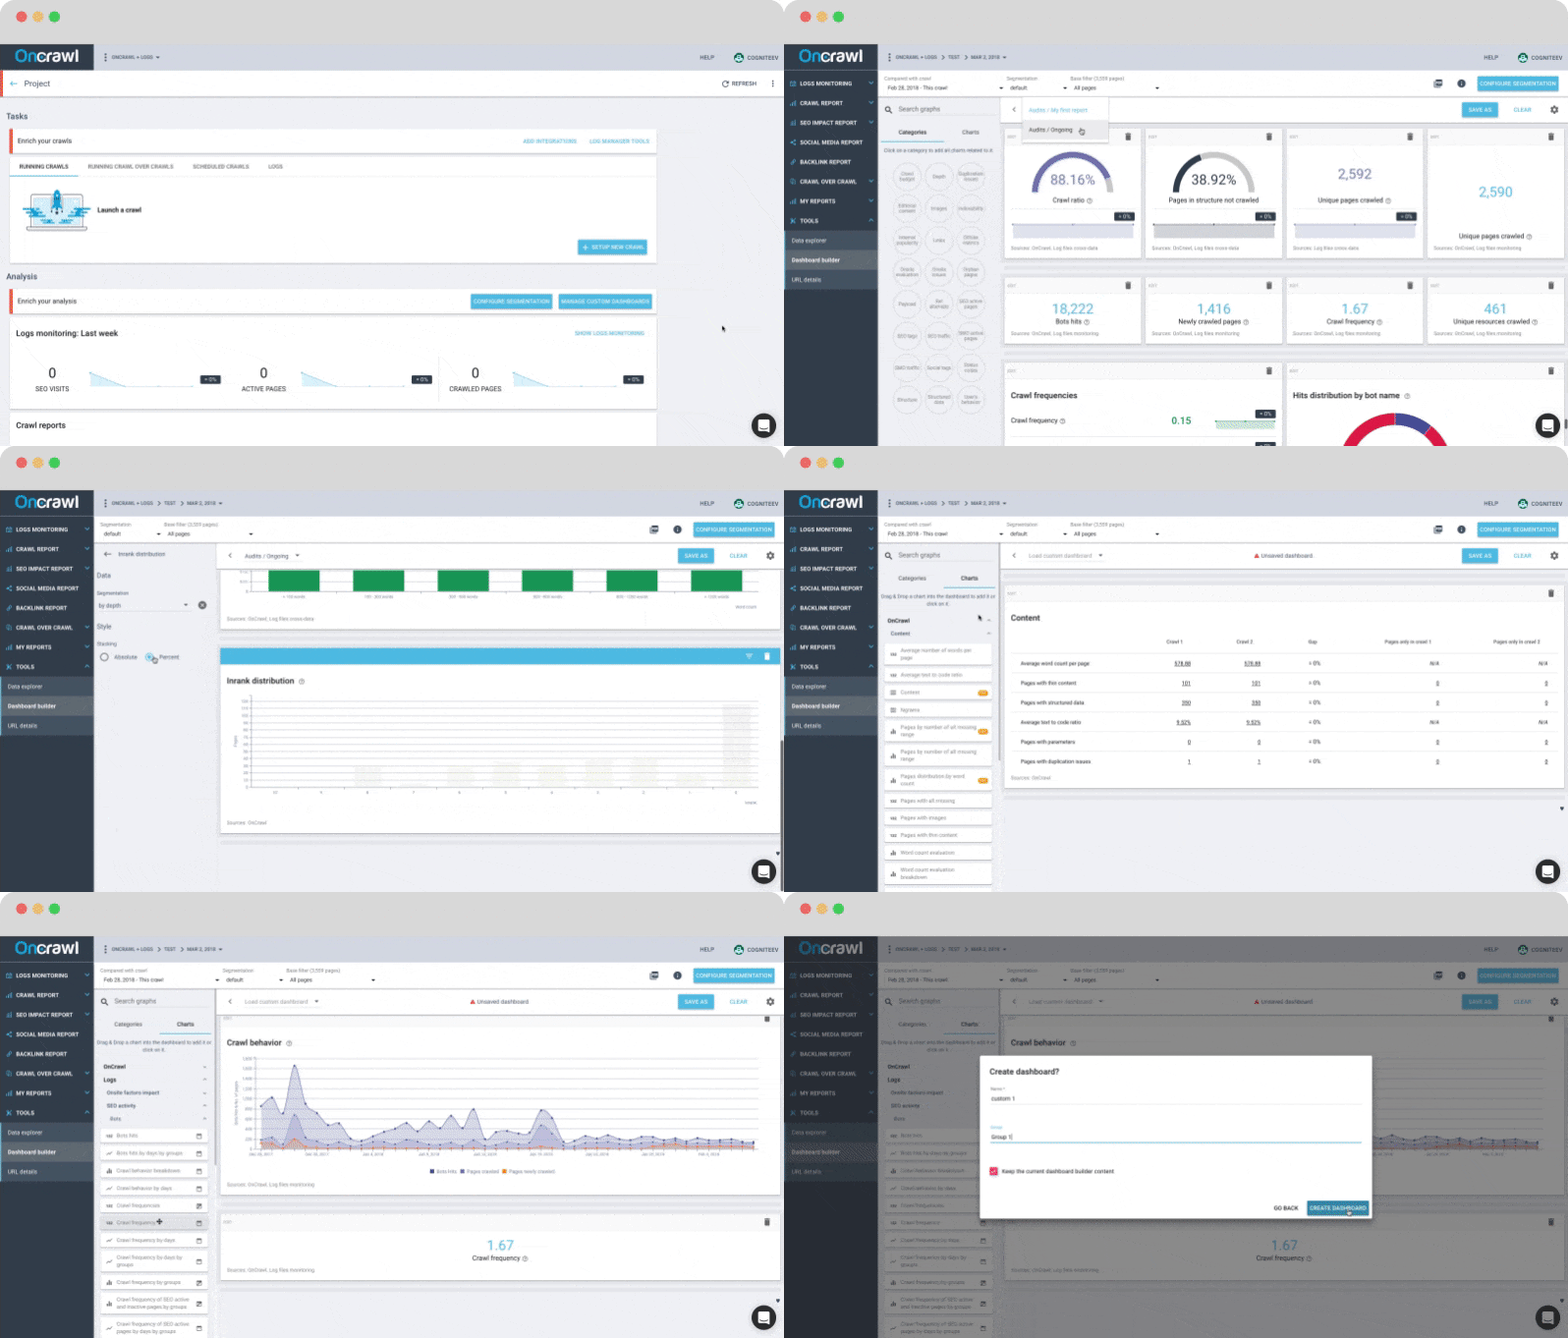
1# How to access your Dashboard Builder
To create a Custom Dashboard, go to your Project Page and click on “Manage Custom Dashboards”.
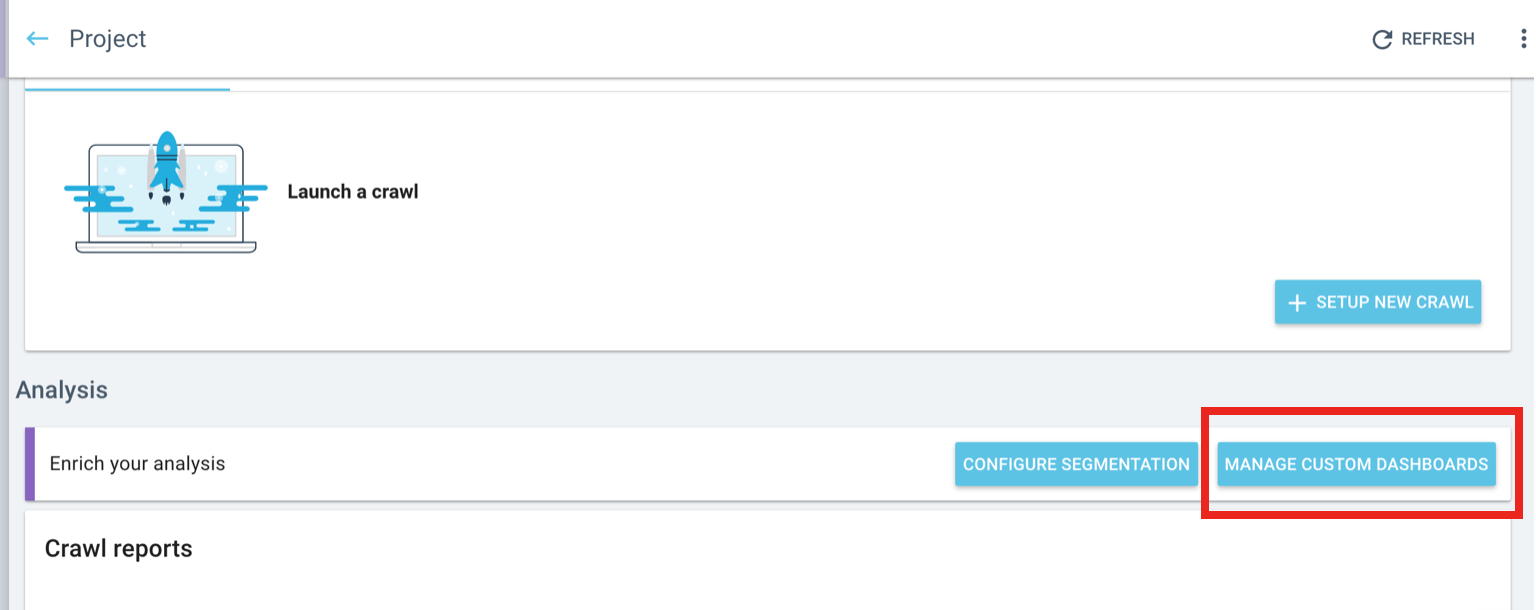
Then, you have two options:
- If you already have created a Custom Dashboard, you could choose that one and modify it. It avoids you to start from scratch. But you can also upload a JSON file from a previous configuration.
- If you don’t have any Custom Dashboard yet, select “Go to dashboard builder” to start building your very first one.

2# How to create a Custom Dashboard
Once you are on the Dashboard Builder Tool (an advanced version of the former Viz Explorer), there are different parameters you can play with:
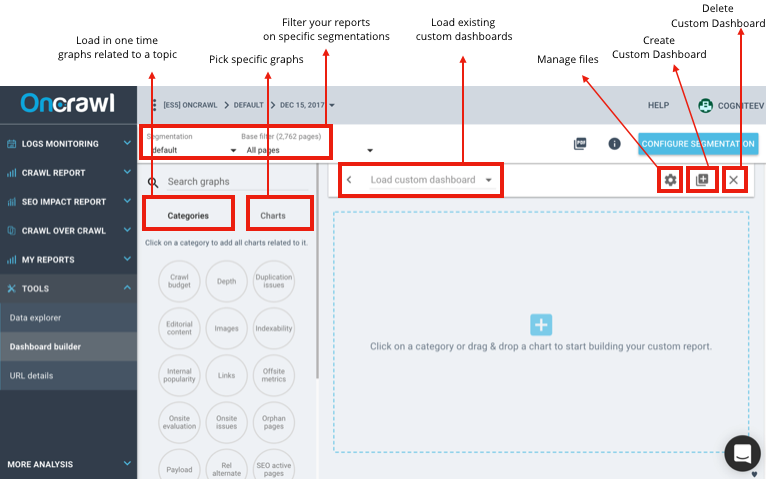
- You can select all charts related to a category and add them at once (content, crawl budget, links, etc)
- You can select a specific graph related to a data source (crawl, logs, analytics, etc)
- You can edit a graph by clicking on its header. Then on the left part and depending on the type of graph, you can choose between a percent or absolute stacking, a logarithmic or linear scale, modify the source of data, segmentation or period.
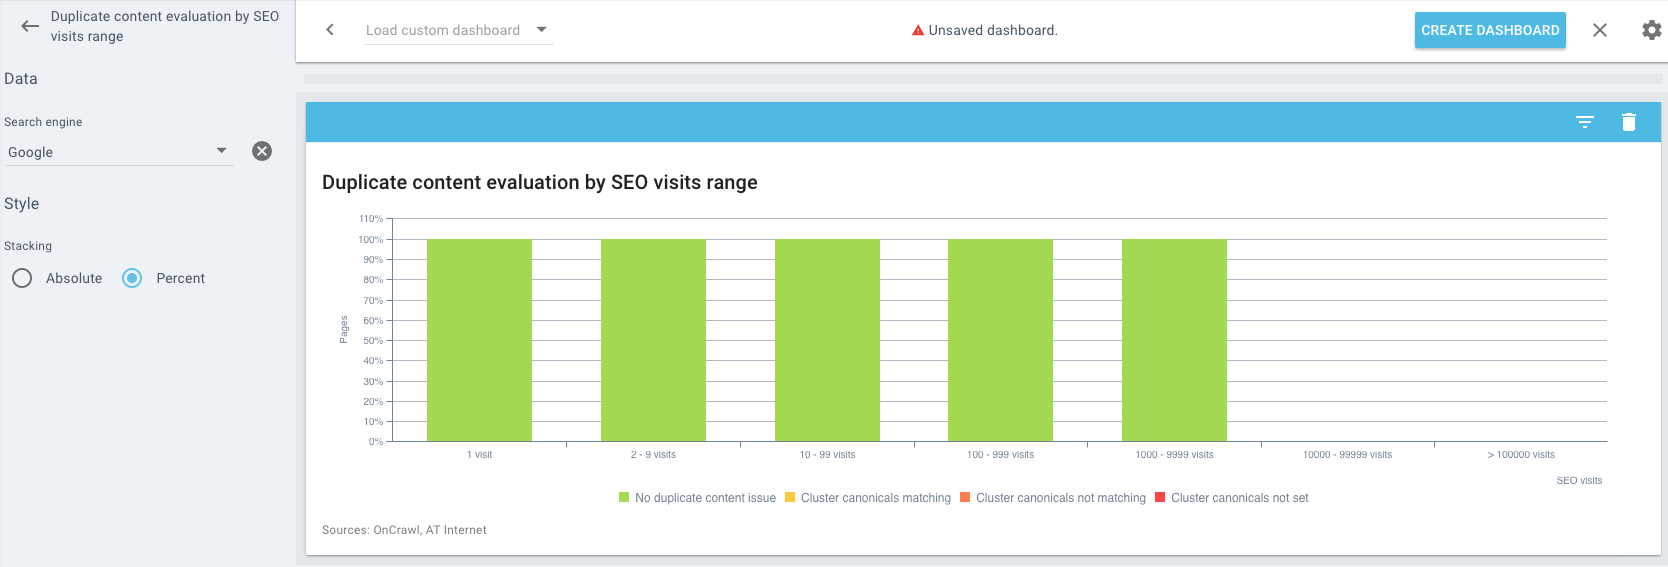
- You can decide to remove a graph at any time by clicking on the trash item on the right corner of each graph. If you need to clear your entire custom report, click on the cross on the upper right corner close to “Create dashboard”.
Pro tips with Custom Dashboards
- Use the search bar to quickly find your graphs
- You can build custom reports based on your segmentation and groups
- You can change the period for log analysis related graphs and filter by bots
- The calendar icon means cross-data reports are activated
- The “CoC” icon means crawl over crawl analysis are activated
- You can export one specific report or all your reports at once
- You can download your configuration as a JSON file
- You can create up to 20 Custom Dashboards per project
3# How to save your Custom Dashboard
When you are done creating your Custom Dashboard, don’t forget to save it by clicking on “Create dashboard”. Name your report to easily find it. You can also classify your reports under groups.
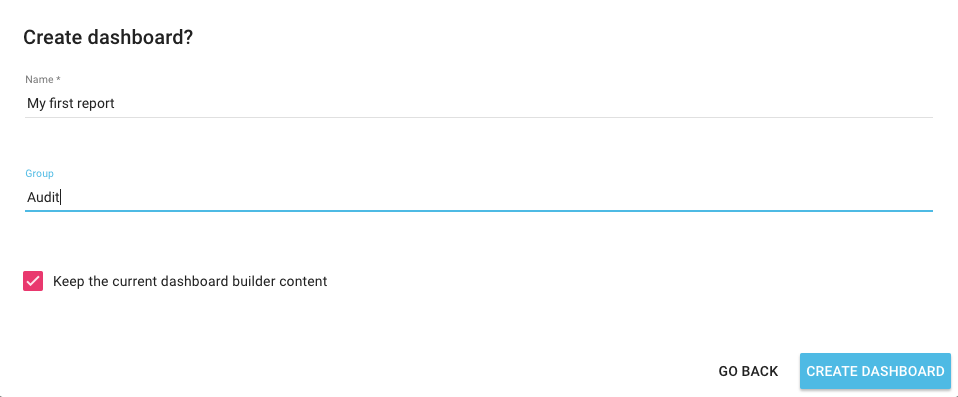
Then, you won’t need to save your report each time you will modify it. Each modification will be automatically saved. But you will be able to find it when clicking on “load custom dashboard”.

Once you have created a Custom Dashboard, you can also find it under the “Report tab” on the left.
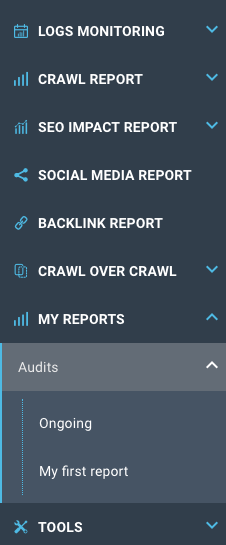
Each custom report are attached to a single project. But you can download your configuration as a JSON file and import it to another project to save time.
We really hope we will enjoy playing with this new feature.
If you have any question, feel free to drop us a line at Oncrawl_CS. Enjoy a 14-day free trial to discover our Custom Dashboards.
