
We are pleased to announce that it is now possible to connect your Google Search Console to your crawl report and access brand new cross-data reports. Welcome to Oncrawl Rankings!
With Search Console integration, you can now follow your indexing rate, understand which factors positively or negatively impact your positions, combine log files and GSC data and monitor how crawl budget is spent regarding your pages’ positions. Access exhaustive and comprehensive data regarding your organic search.
Using Oncrawl Rankings, you will be able to:
- Understand how your site is found and how it ranks
- Analyze the indexing rate in SERPs
- Understand positive and negative factors influencing positions and impressions
- Understand if crawl budget influences positions
Oncrawl Rankings addresses one of the key issues faced by search marketers and, for the first time, provides a comprehensive, cross-sectional view – between crawl, log files and GSC data – of natural search results performance using accurate, comprehensive and scalable data.
Google Search Console, the indispensable tool for every SEOs
Google Search Console is a powerful tool that every SEOs should use but yet often limited. It helps improve a website’s crawlability, indexability and learn more about user queries. However, Google Search Console offers limited data visualisations and details regarding URLs, keywords, positions and impressions.
In fact, it is only pulling up the first 1,000 user queries per site.
Oncrawl is using the Search Console API that lets us retrieve ALL user queries. Oncrawl is one of the only Technical SEO platform that combine precise insights about your user’s queries, your technical SEO KPIs and that provide a complete picture of the URLs on your website.
Oncrawl Rankings then combines data from your Google Search Console with your existing crawl data to deliver unrivaled reports.
Enabling Search Console as a new Oncrawl integration
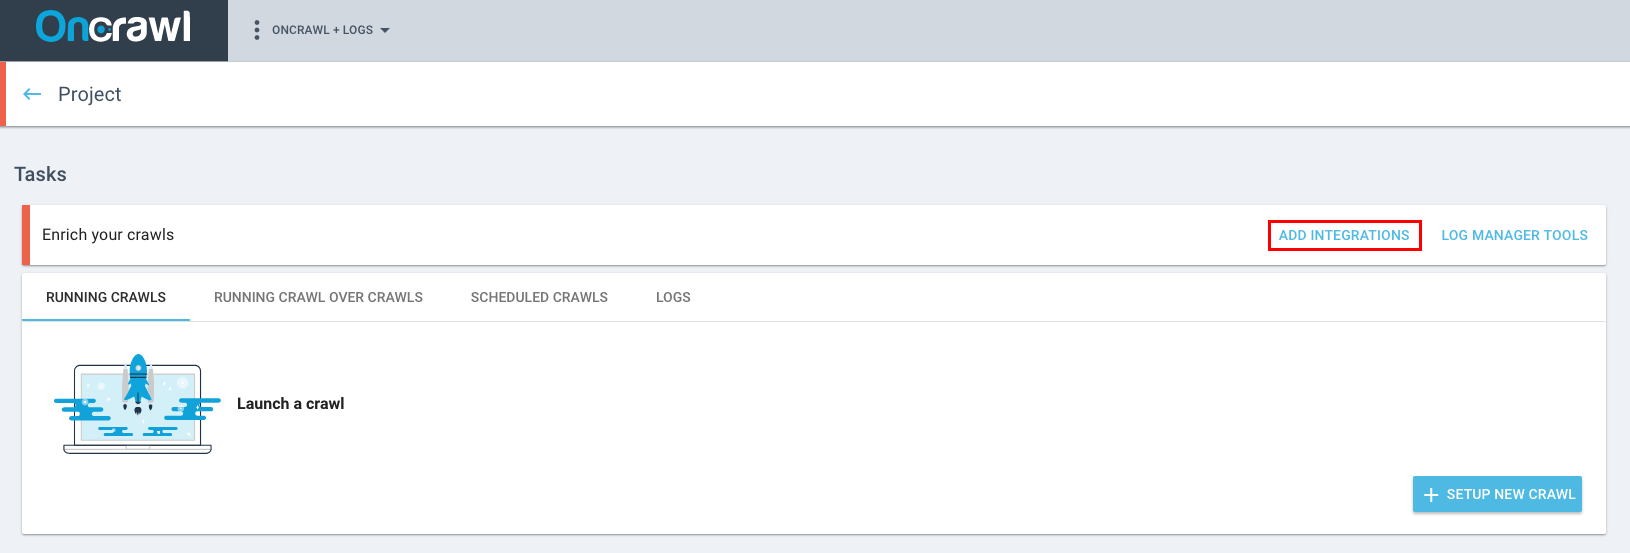
Accessing this new cross-data analysis is a really simple process. Head to your project home and click sur “Add Integrations”.
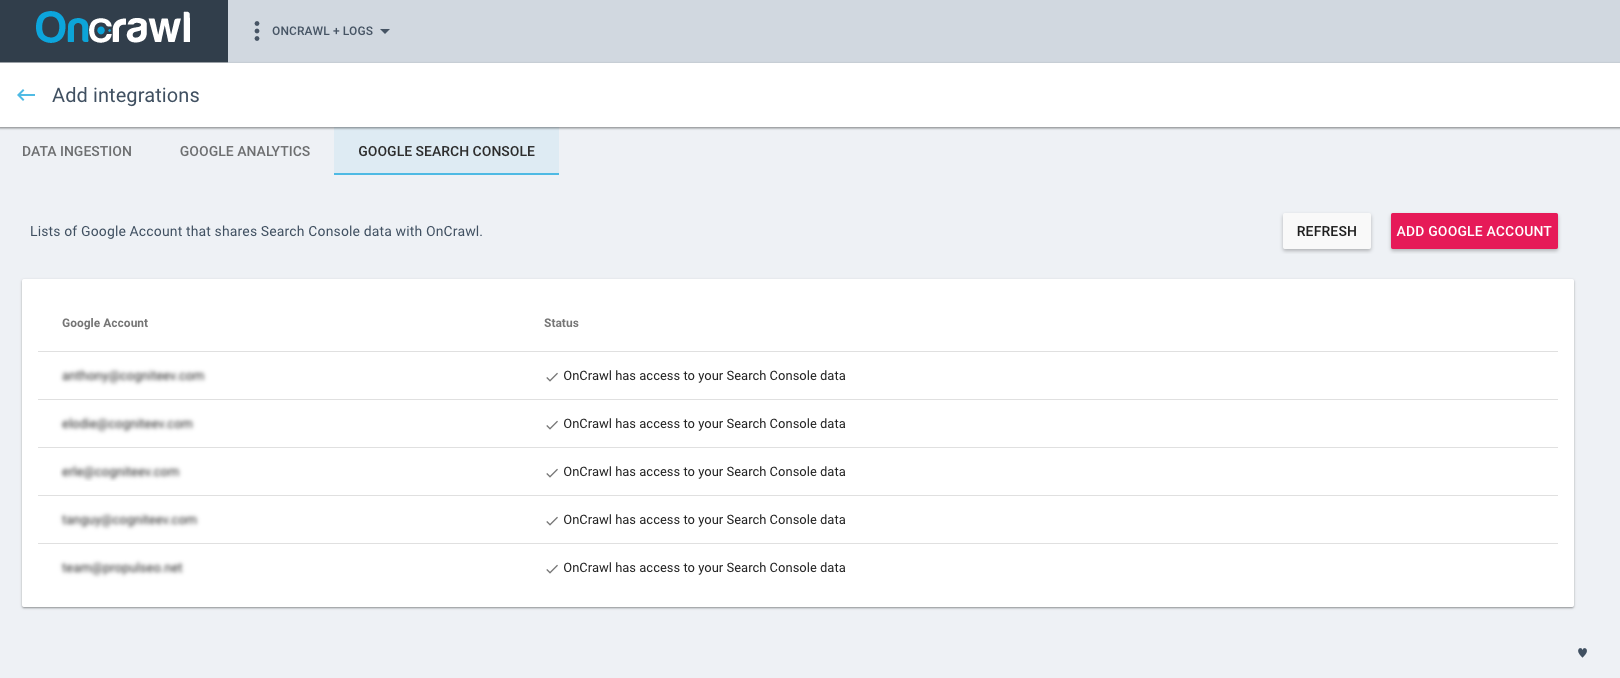
Then, select “Google Search Console”. Here, you can add and connect your Google account to grant Oncrawl the access to your Search Console data. Oncrawl Rankings will then compute data on a 45-day range.
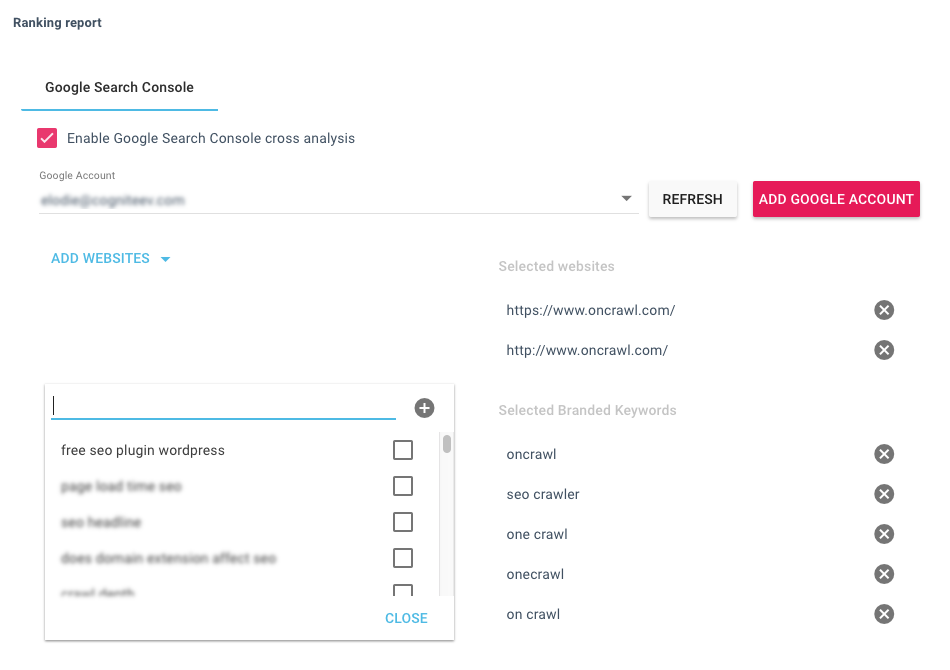
Then, select “Launch a new crawl” and head to the “Ranking report” tab. Don’t forget to tick the “Enable Google Search Console cross-data analysis” box.
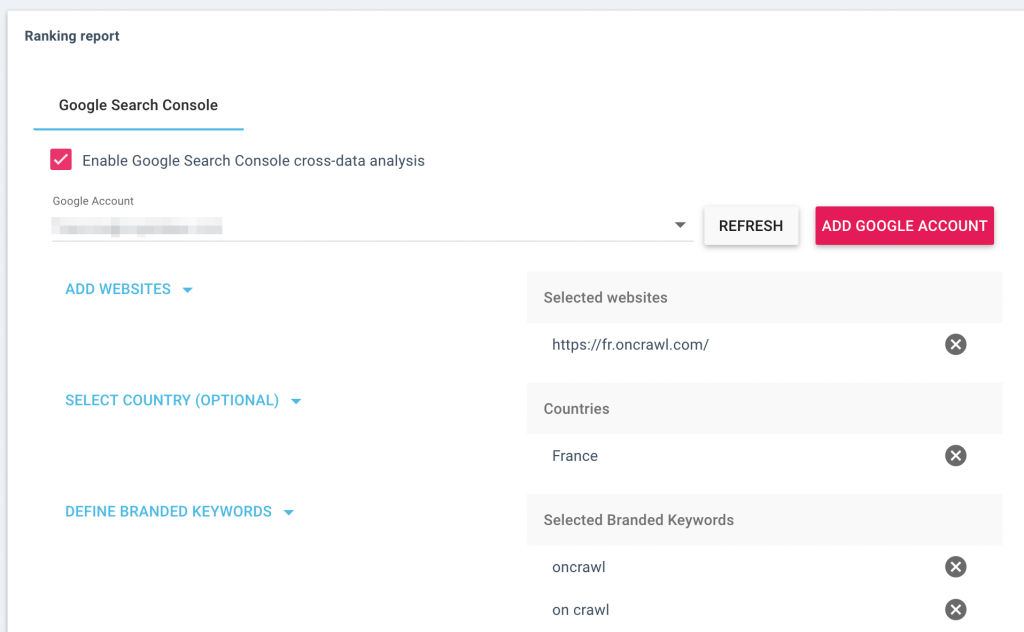
Here, you have the opportunity to choose different views and properties for your website by clicking on “Add websites”.
Filtering and setup options
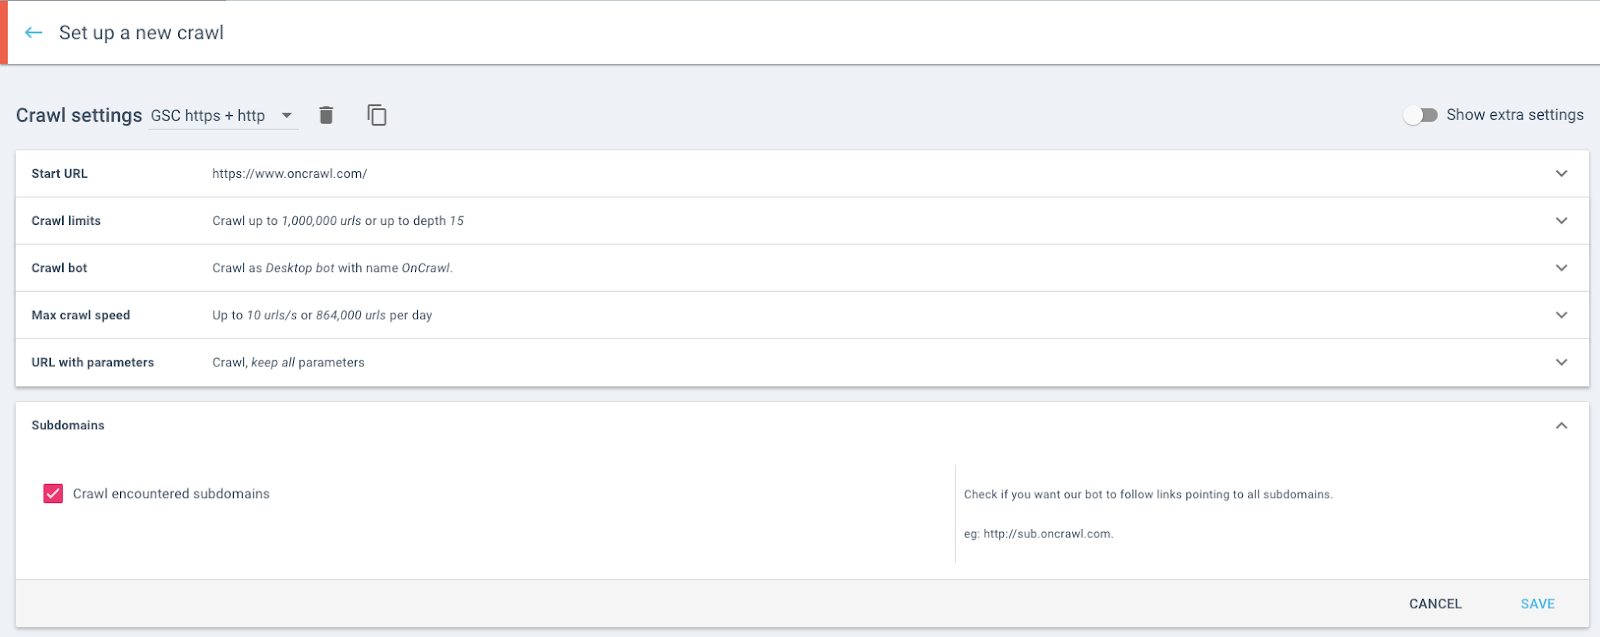
- If you choose to add a subdomain from your Search Console that is different from your start URL, be sure to activate the “crawl subdomains parameters” when setting up your new crawl.
- Website properties. A URL can be found in different properties. If several properties contain identical URLs, Oncrawl will only retain the last value found for a URL.
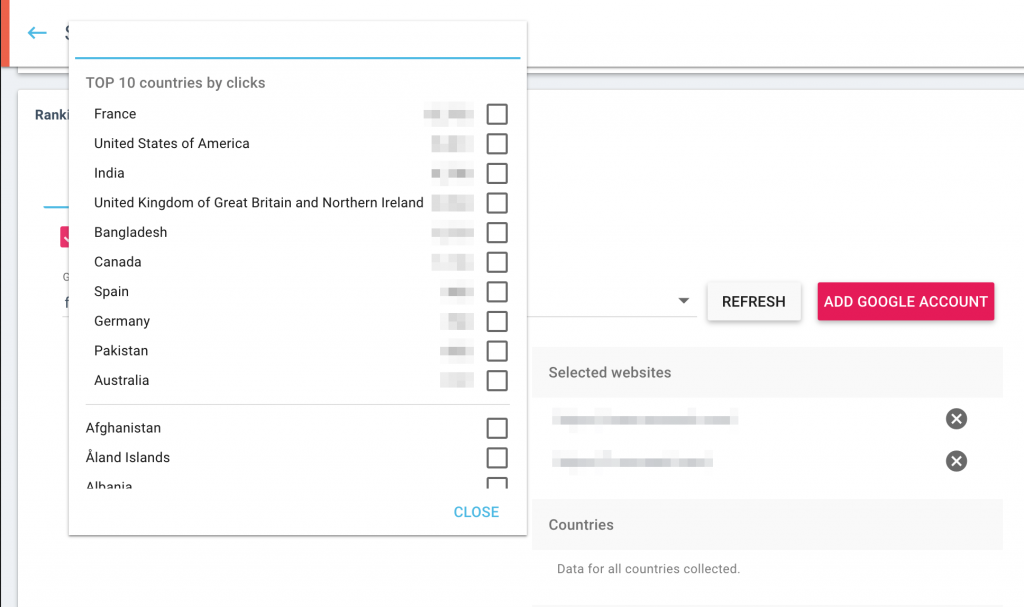
- Optional country filtering. You can choose to limit the data in the ranking report to data for specific countries only. We provide you with the list of the top 10 countries that generate the most clicks on your websites to help you out. Oncrawl will collect, aggregate, and display data for the selected countries. (This can’t be broken down later.)
This is optional. If you do not choose a country, your ranking report will be based on worldwide data.
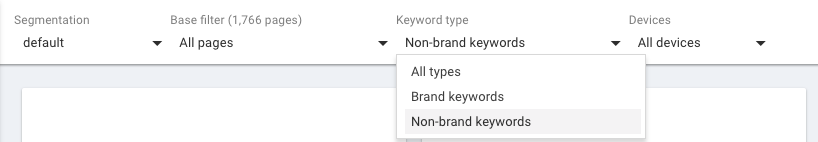
- Branded keywords. You can choose to flag branded keywords using the “Selected branded keywords” option. We offer suggestions from GSC for the top 150 impression-generating keywords. You can also keywords manually if they don’t appear in the list. When viewing the results in the ranking report, you will be able to select filters for branded keywords, non-branded keywords, or all keywords.
Oncrawl Rankings: New Technical SEO KPIs to monitor
Understand how your site is found and how it ranks
Oncrawl Rankings gives you a clear overview of your site’s keywords distribution, impressions and clicks over time whether it is on desktop or mobile, for branded or non-branded keywords or regarding your groups of pages.
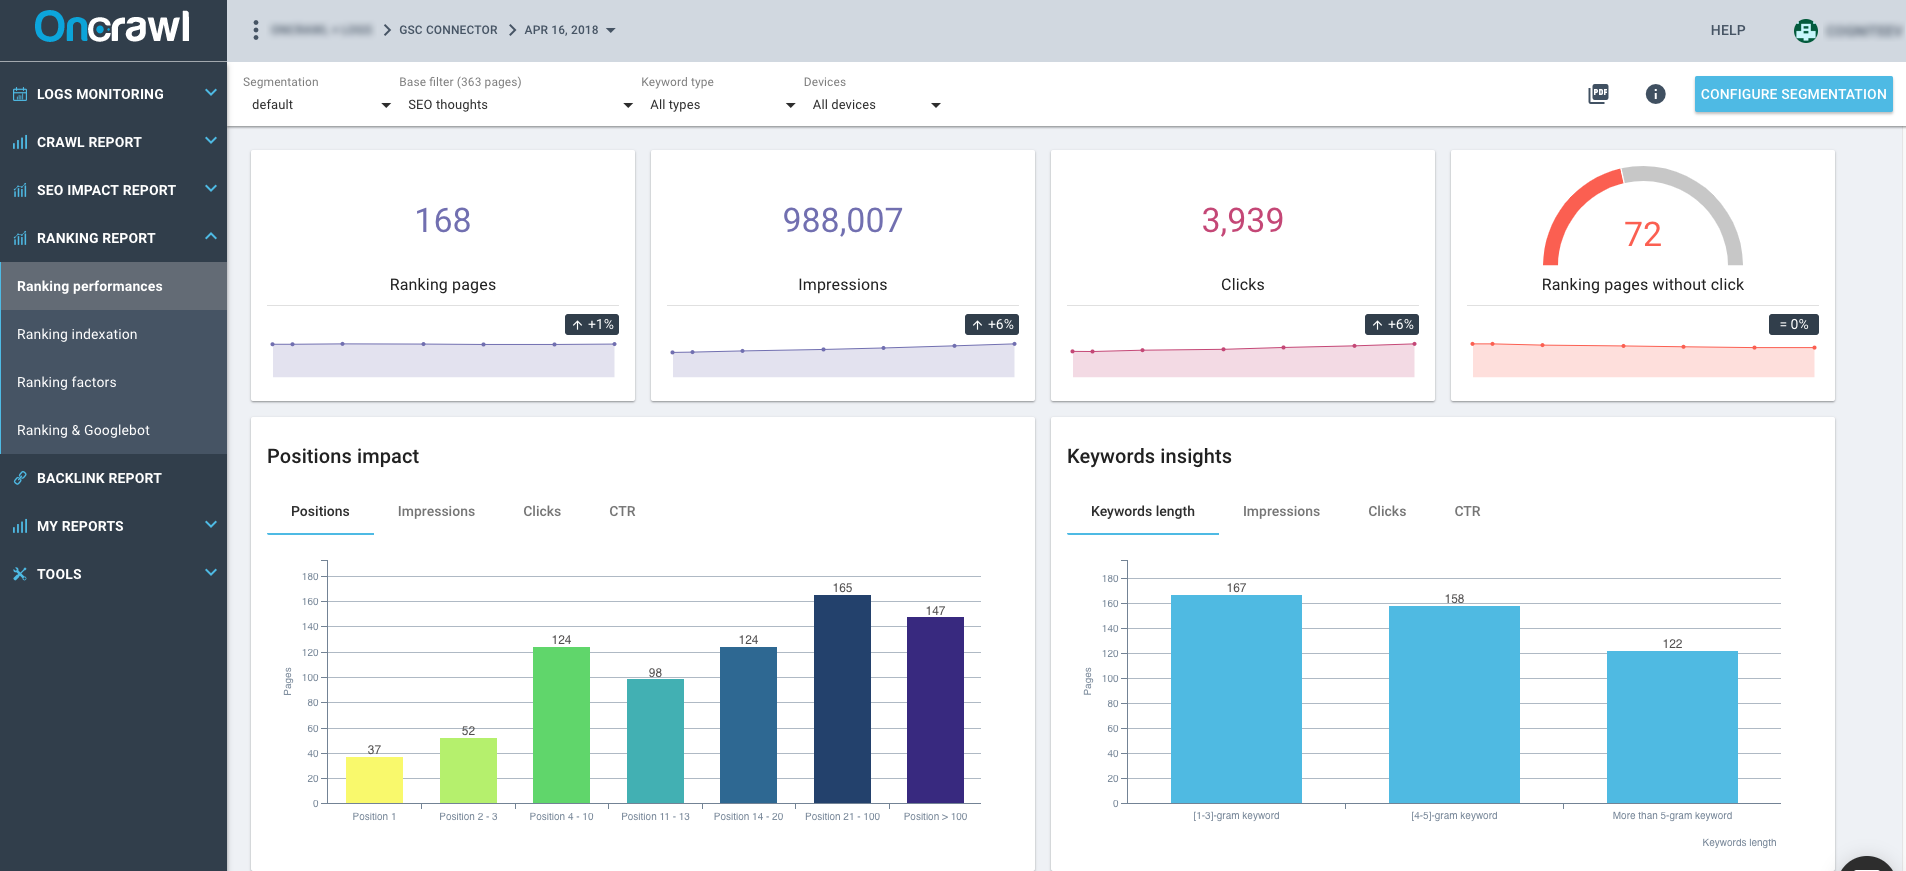
The ‘Ranking Performance’ tab gives you insights by groups of pages, devices and keyword types regarding:
- Number of indexed pages;
- Number of impressions;
- Number of clicks;
- Number of indexed pages without click;
- Number of impressions, clicks and CTR regarding your keyword length.
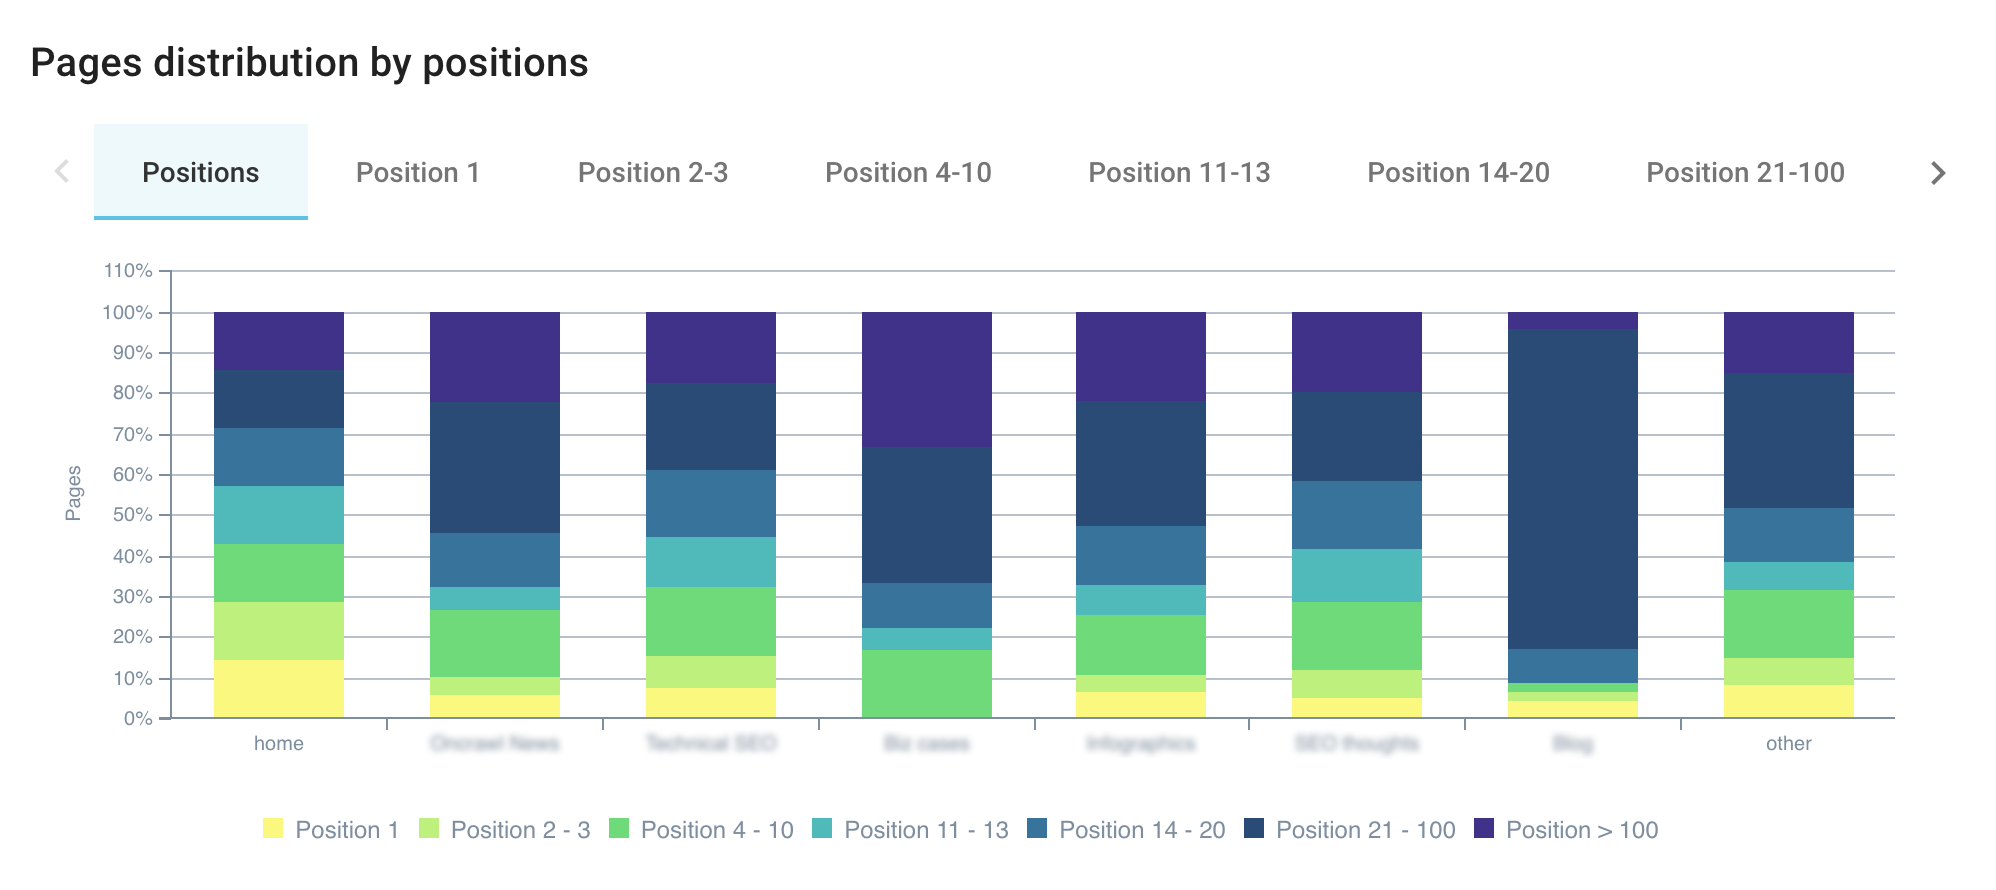
You can also access precise data about your positions distribution:
- How many pages are indexed in position 1 but also in deeper positions?
- How many impressions do pages receive regarding their positions?
- How many clicks do pages receive regarding their positions?
- What is the CTR distribution regarding your pages’ positions?
- What is your distribution of positions regarding your groups of pages?
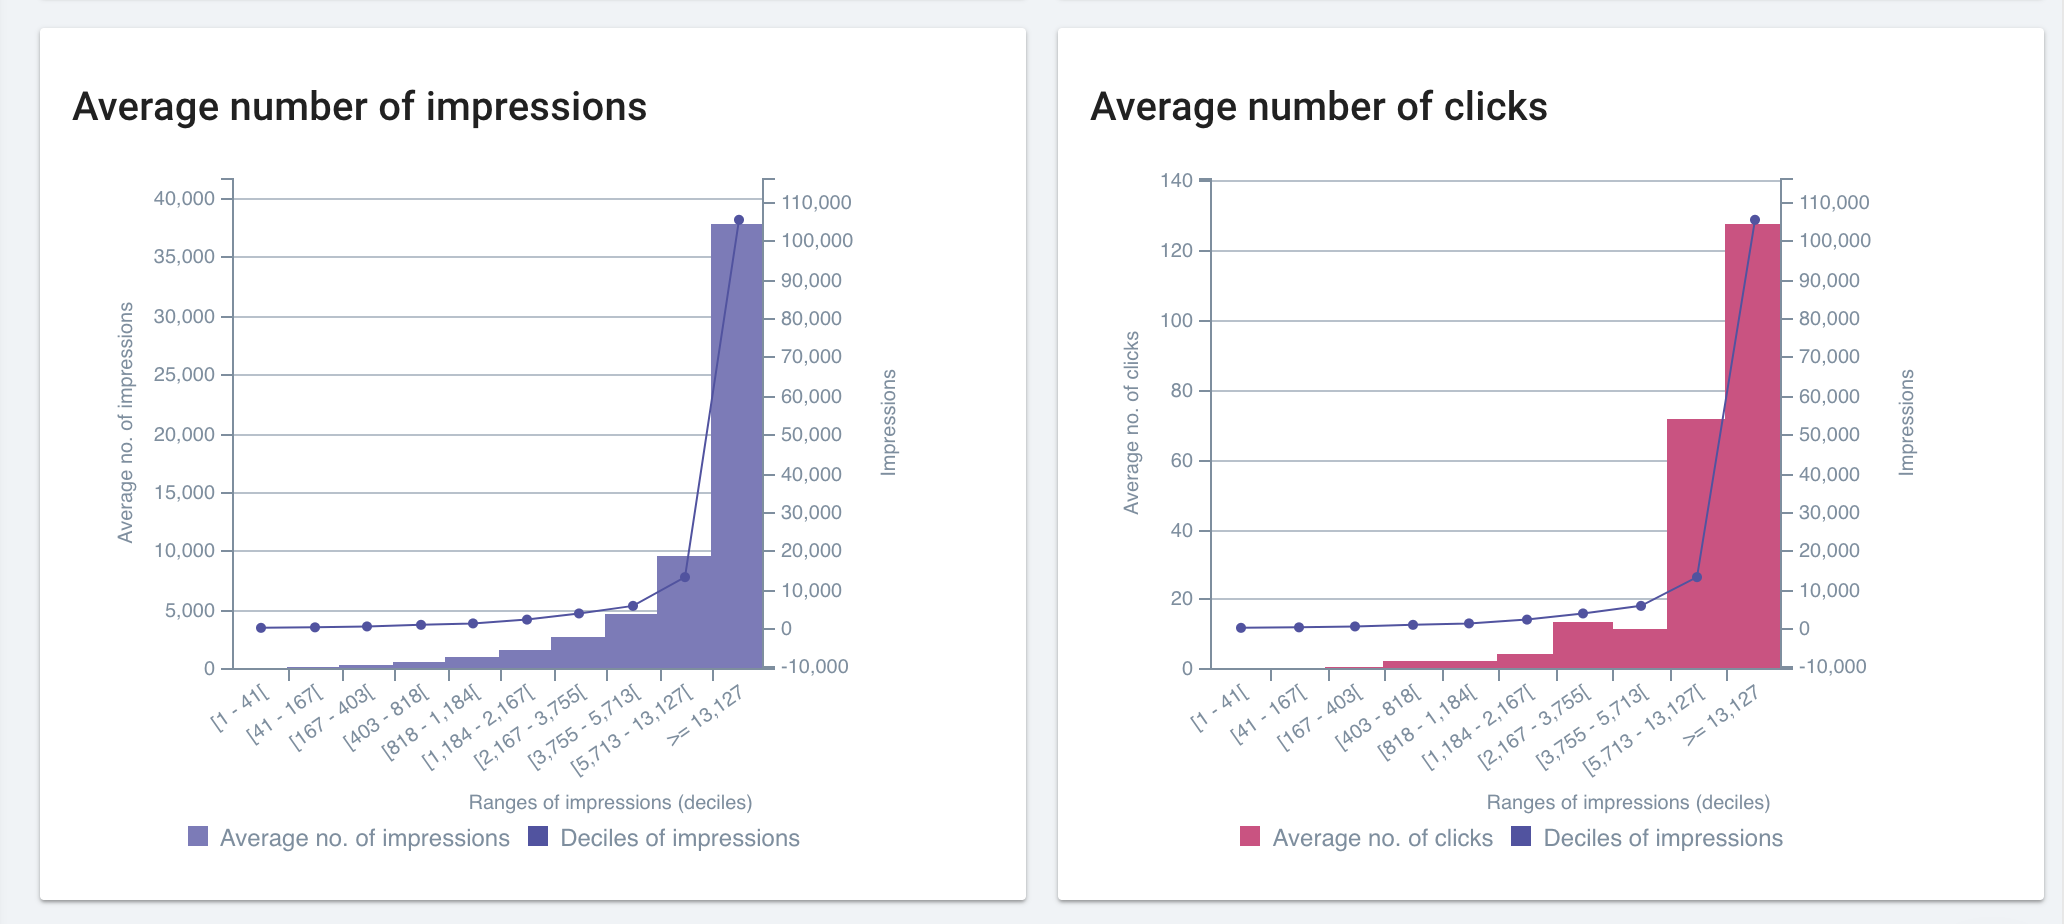
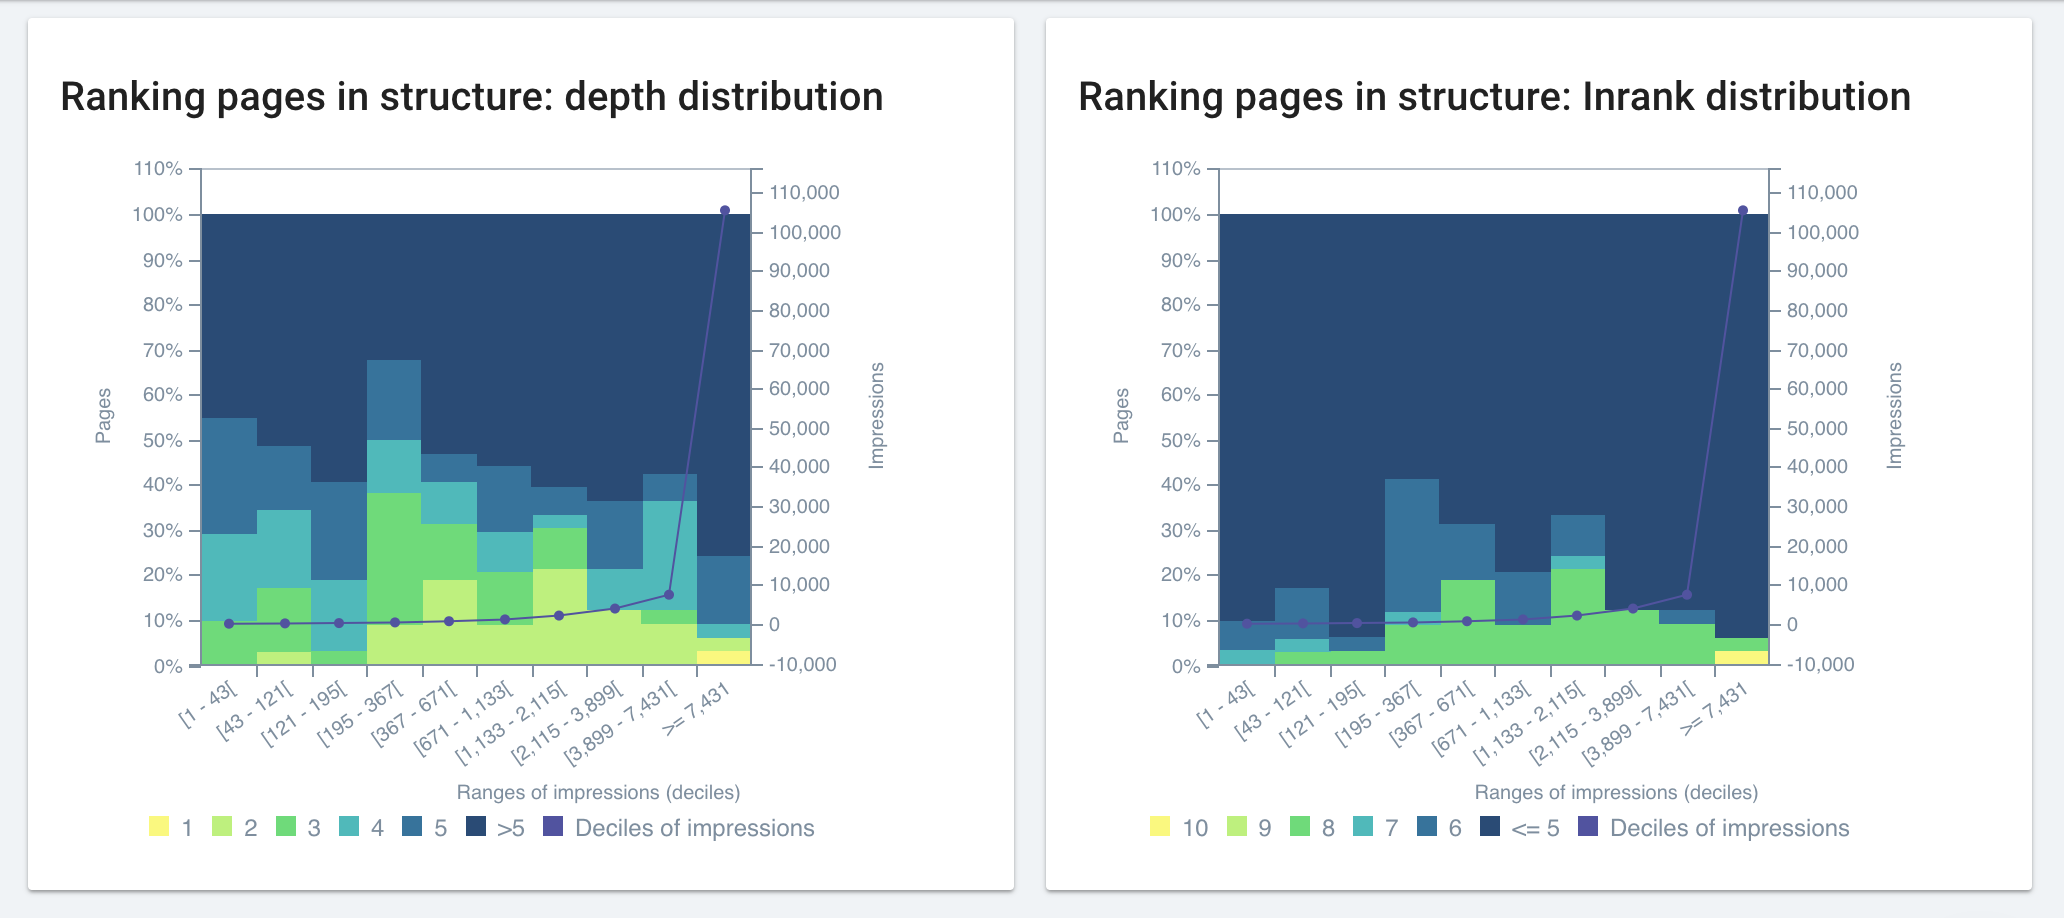
Deciles, a new way to measure SEO gaps
With Oncrawl Rankings, we have introduced a new way to calculate ranges: deciles.
A decile is any of the nine values that divide the sorted data into ten equal parts, so that each part represents 1/10 of the sample.
Using deciles in your SEO analysis lets you understand the volume of pages that perform or not but it also shows inequalities and gaps in a dataset.
In these graphs, impressions have been divided into deciles. On the left part, you can see deciles that generate the less impressions and on the right part the ones that generate the most impressions. On these two examples, most pages generate more than 13k impressions on average and 127k clicks.
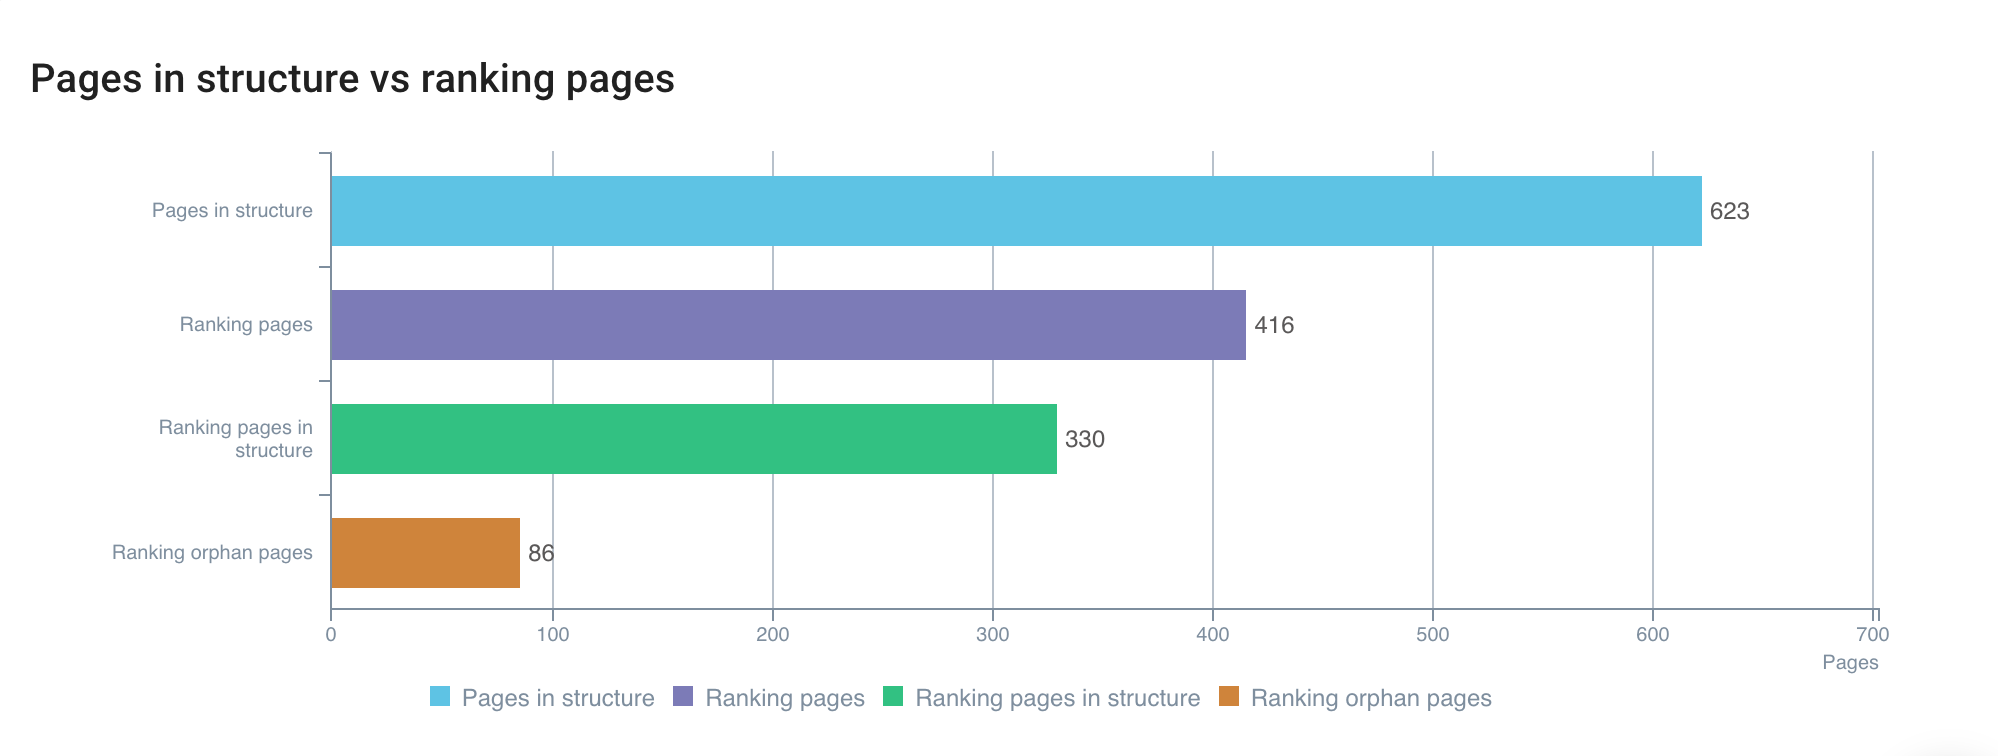
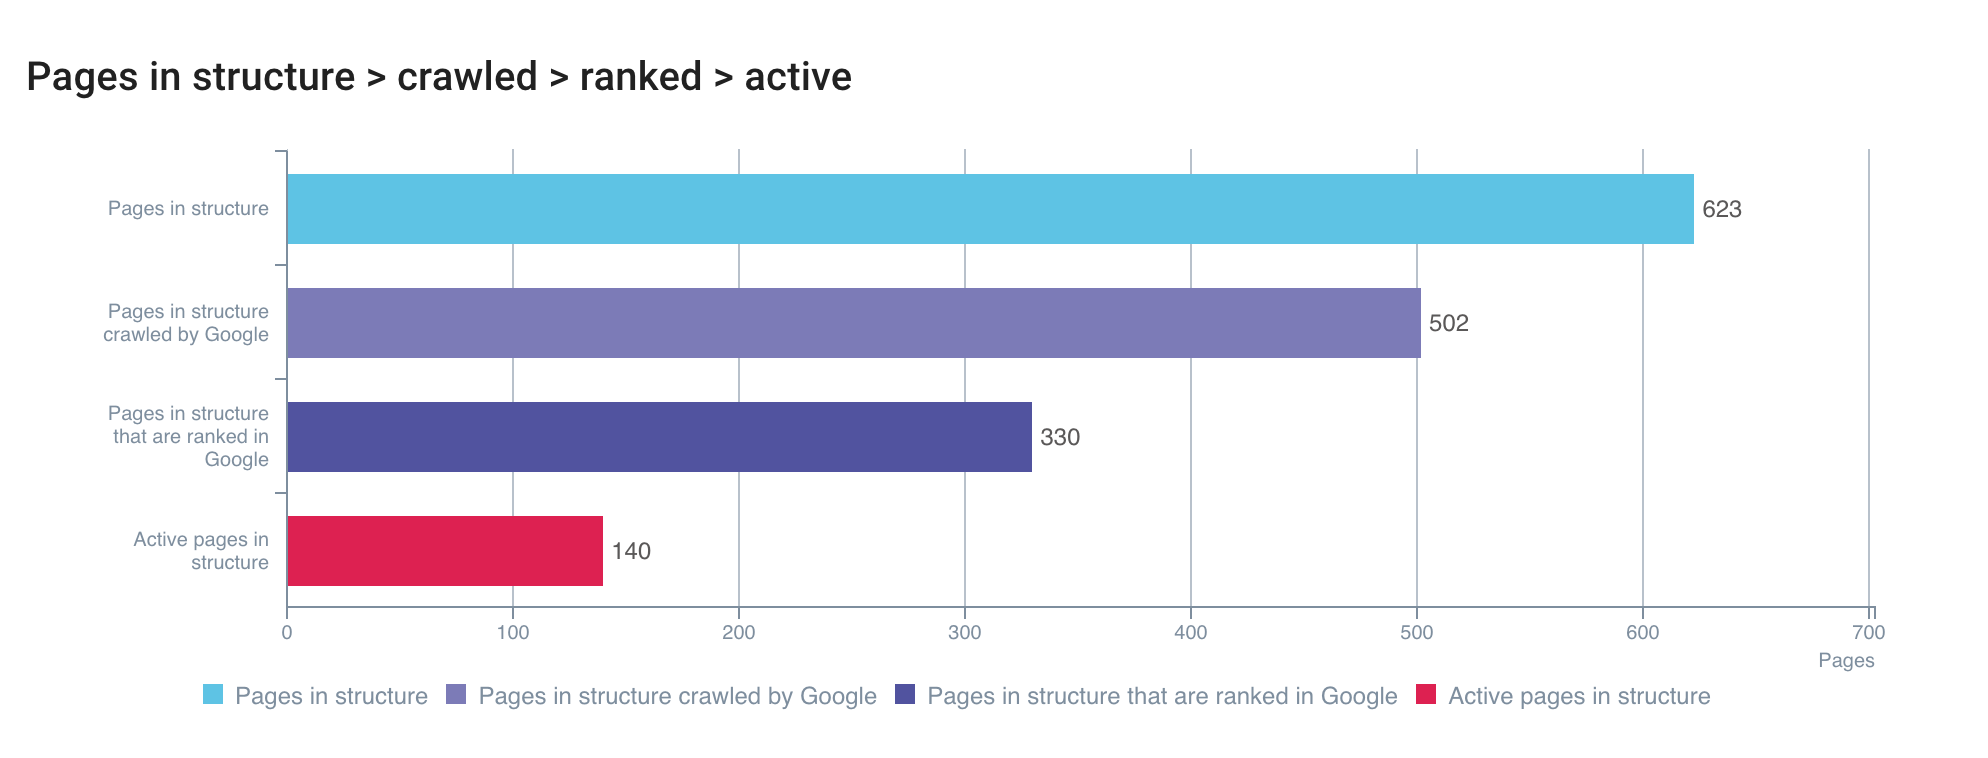
Analyze the indexing rate in SERPs
With Google Search Console cross-data analysis, we have built a whole dashboard dedicated to your indexing state regarding:
- Pages in the structure;
- Ranked pages;
- Ranked pages in the structure;
- Ranking orphan pages.
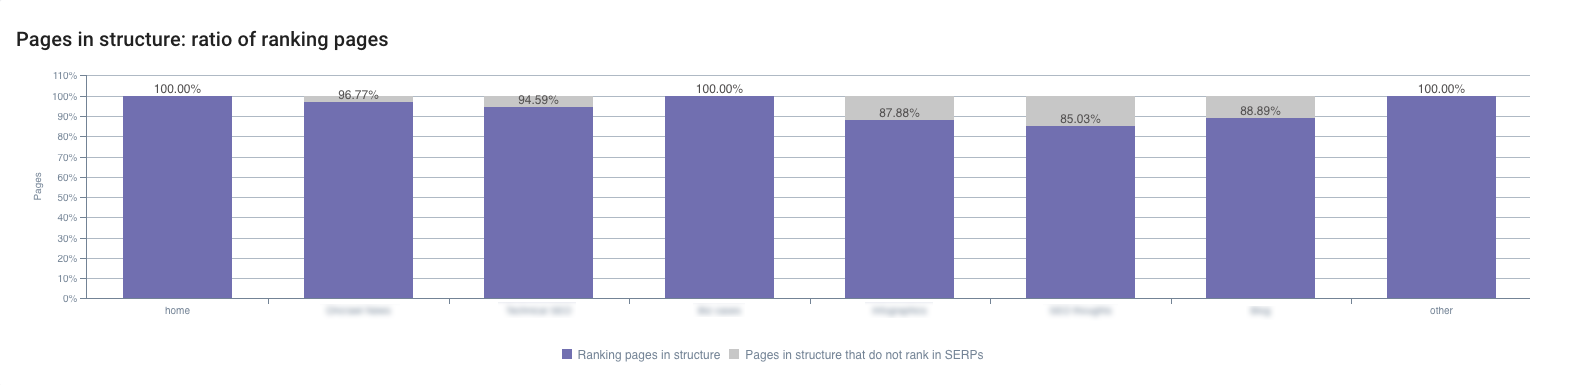
The Oncrawl ‘Ranking Indexation’ report lets you also understand how your ranked pages are distributed within your groups of pages and their ratio regarding a group of page.
But also how many of your indexed pages are orphans by:
- Groups;
- Range of impressions;
- Number of impressions and clicks generated by orphan pages.
Understand positive and negative factor influencing positions and impressions
With Search Console integration to your crawl report, we let you understand the influence of the most important on-site SEO ranking factors on your positions, impressions and CTR.
Using the decile measure, you can thus easily identify the common characteristics of pages that rank and those which don’t (as decile ranges remain the same and let you pinpoint trends).
We focus on:
- Depth;
- Inrank;
- Word count;
- Inlinks;
- Load time;
- Title evaluation;
- Description length & Structured data and their impact on CTR.
Depth & Inrank
Within your pages that generate the most impressions, how is depth distributed? Are pages located close to your home the ones that receive the most impressions? On the other hand, do pages close to your home but with fewer impressions have an optimized internal linking? Are you leaking some link juice to pages that don’t generate that much impressions?
Using the Inrank distribution report, you can also understand if your internal popularity is positively influencing your impressions.
Number of words
Oncrawl Rankings shows you the impact of your word distribution on your impressions.
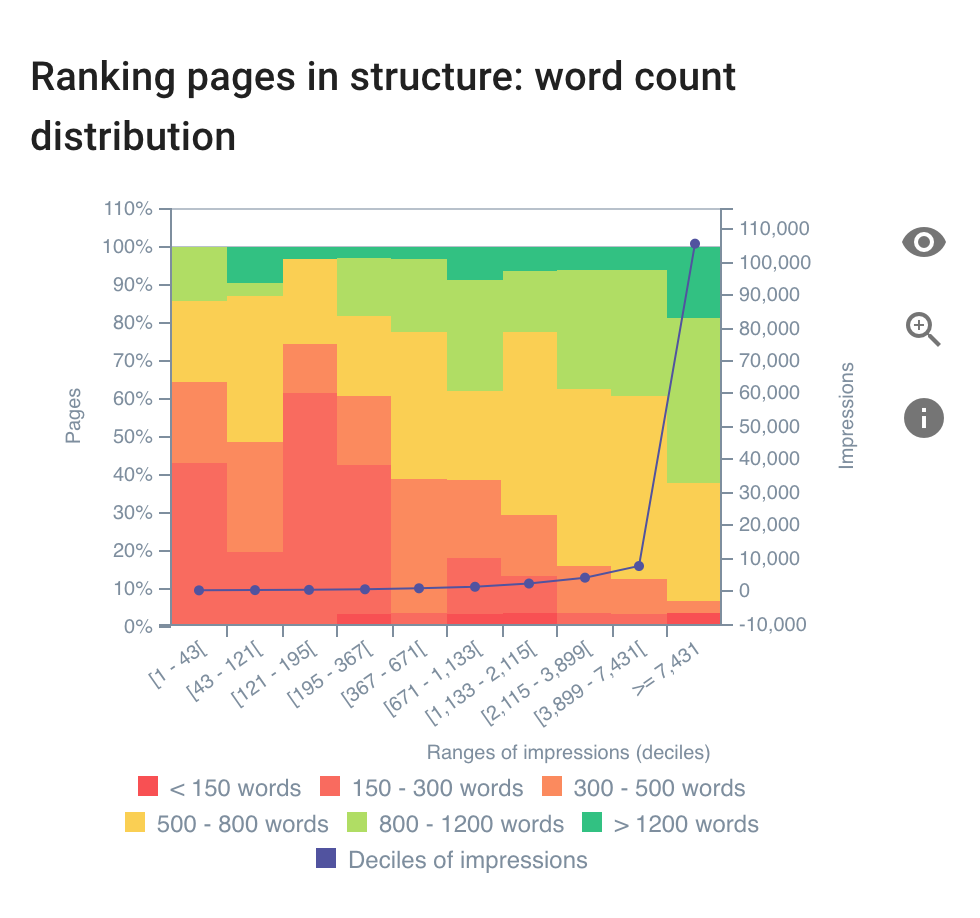
On this example, it is clear that pages with richer content tend to receive more impressions. This graph is great to help you optimize your editorial strategy and your copywriting efforts.
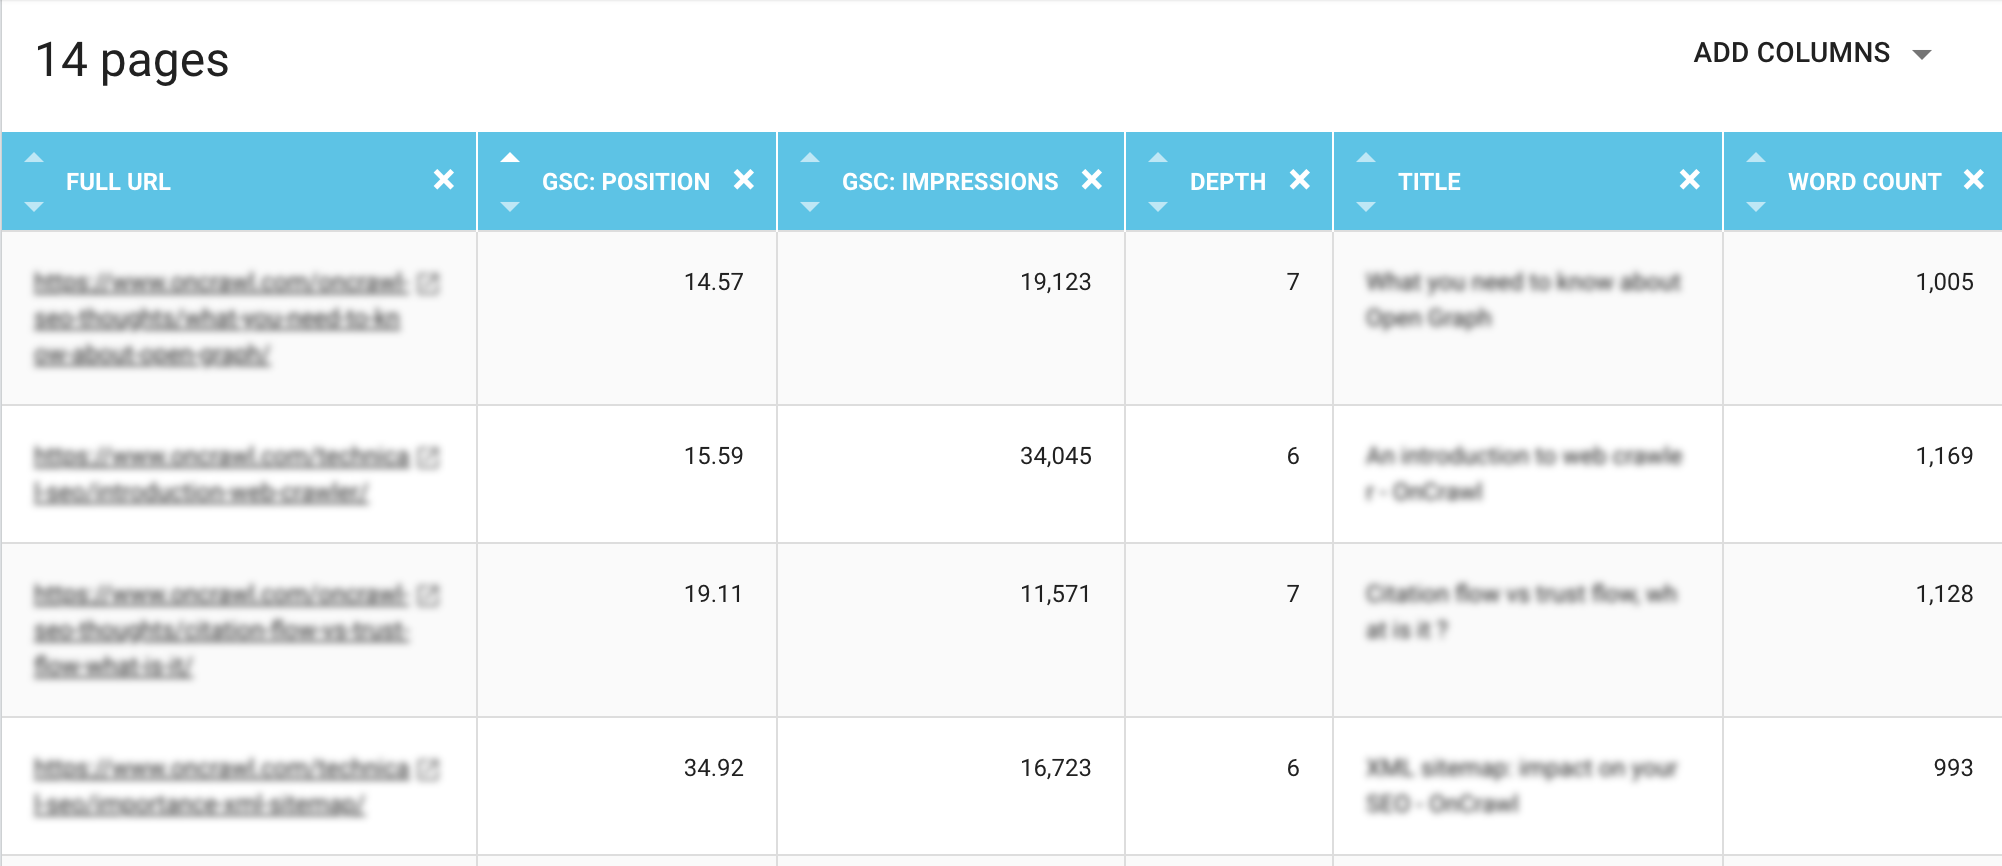
By clicking on a chart section, you can access further details regarding your ranking pages and add as many filters as you need.
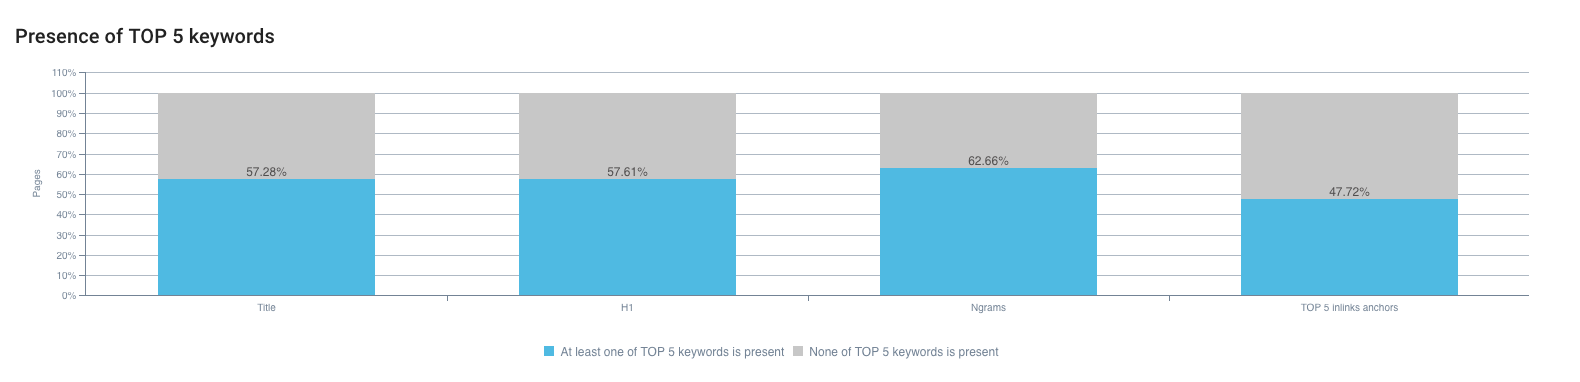
Keyword detection
Oncrawl also looks for the presence of the 5 keywords generating the most impressions in titles, H1, n-grams and in the TOP 5 inlink anchors.
It shows, in blue, pages for which at least 1 of the top 5 keywords has been found either in their titles, h1, n-grams or inlink anchors.
Understand if crawl budget influences positions
We have taken a step further by combining your crawl, logs and GSC data within the “Ranking & Googlebot” tab.
With the crawl data, you were able to draw a picture of all your pages. With the log files analysis, you knew the ones that were crawled and where Google was spending its crawl budget. Now, with the GSC integration, you can also highlight your indexed pages but also if your crawl budget is influencing your positions and if Google is not wasting its budget on pages that are wrongly indexed.
 Using our data you can highlight:
- Pages crawled by Google but not indexed;
- The average number of impressions by pages crawled by Google;
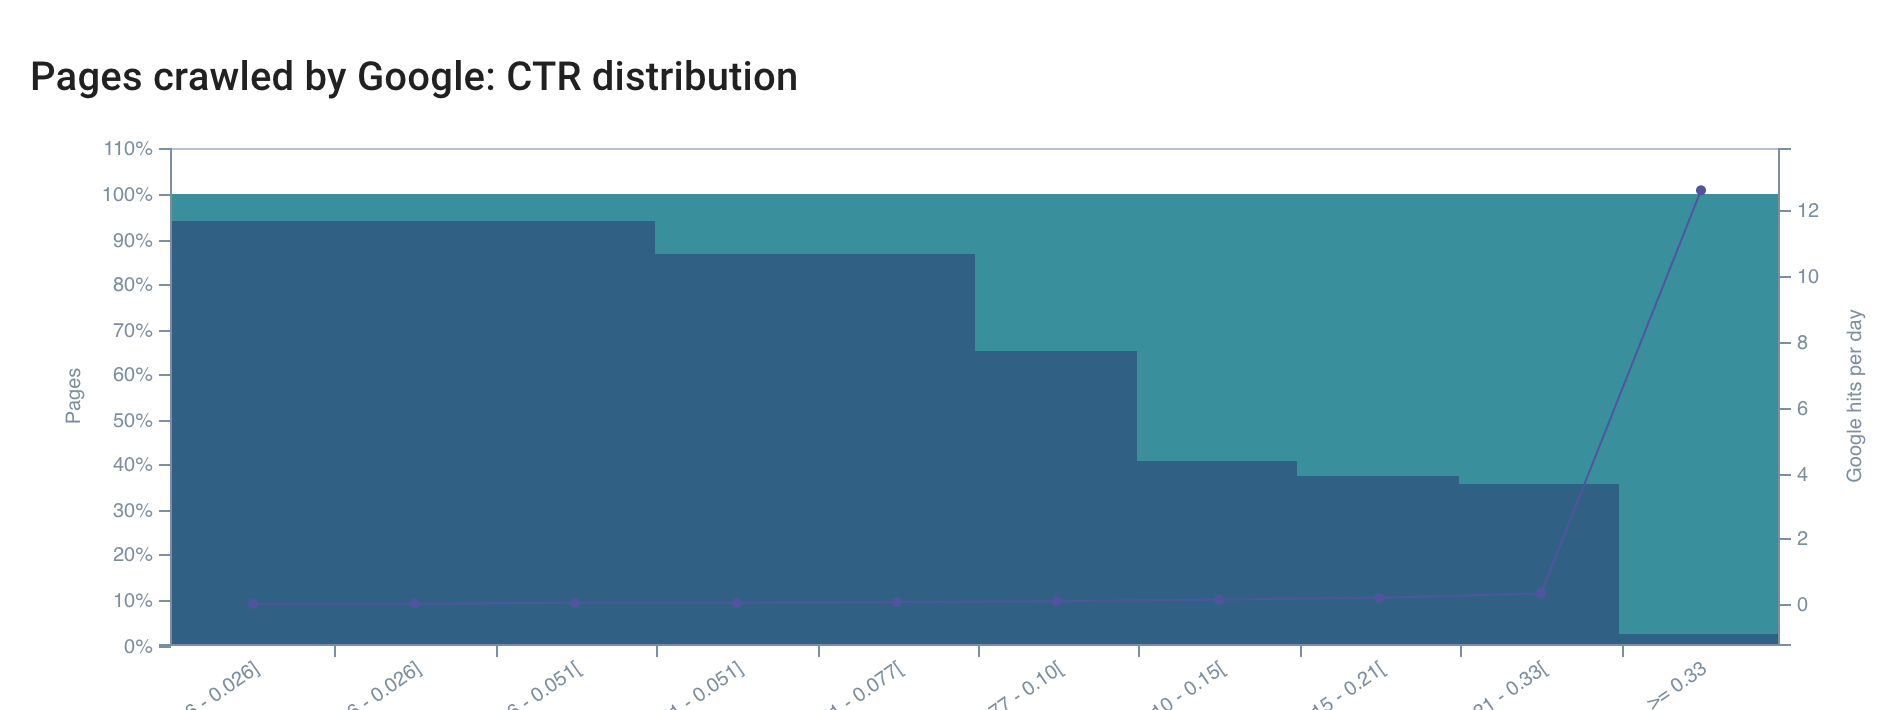
- The CTR distribution by pages crawled by Google;
- The position distribution by pages crawled by Google;
- The average positions between crawled and indexed pages;
- The ratio of ranking pages by pages groups crawled by Google.
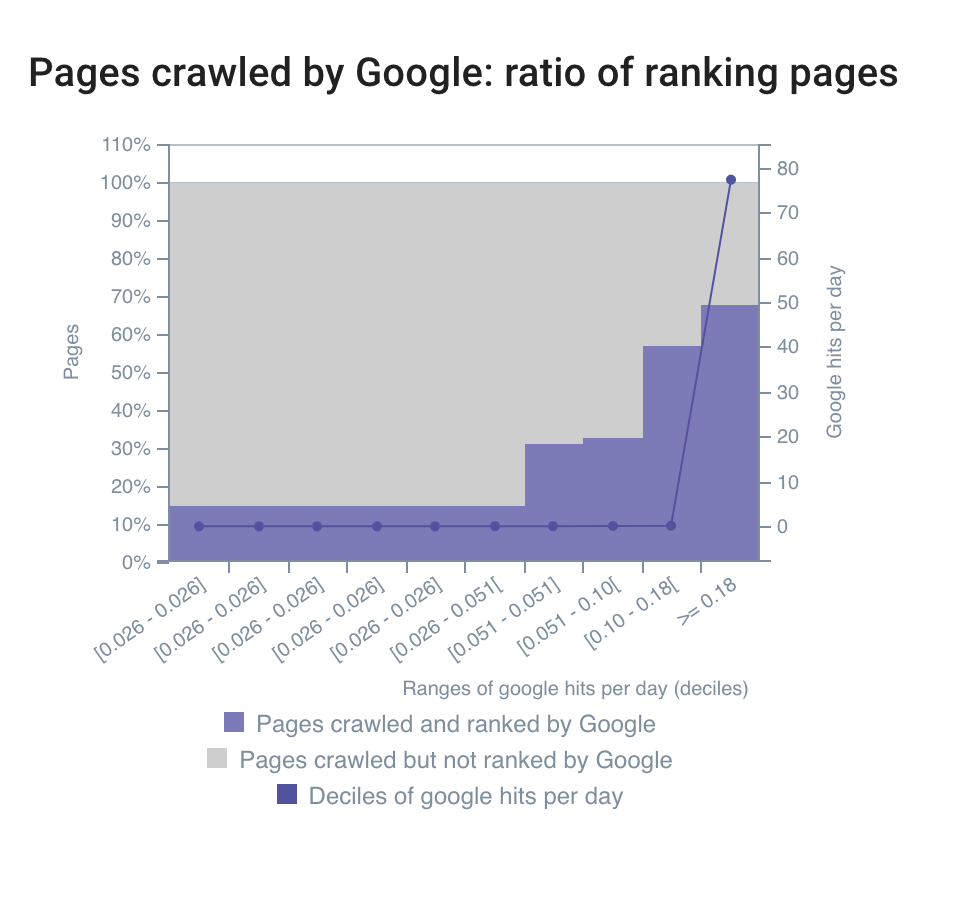
The “Ranking & Googlebot” report lets you understand if Google is frequently crawling pages that rank well in the SERPs or not to accordingly optimize your crawl budget.
Using the CTR distribution graph regarding pages that Google crawls, you could anticipate Rankbrain’s penalties. In fact, pages that rank well but which receive a low CTR can be downgraded by Google.
You can also check your CTR distribution by position.
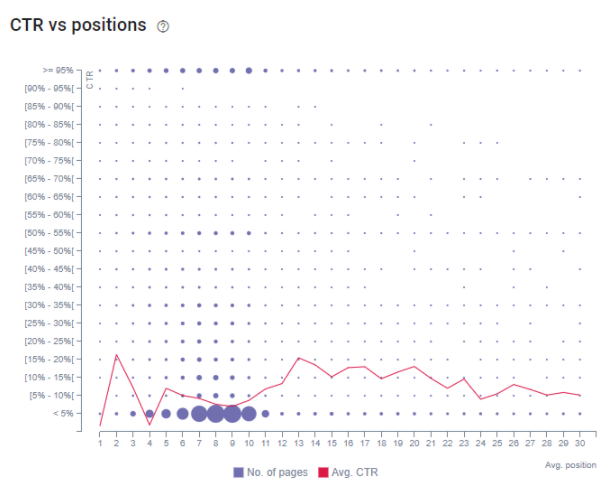
Each dot represents a group of pages and its size varies with the number of pages. The line shows the average CTR by position.
More analysis are available within Oncrawl Rankings.