On November 24th, Google released a new version of their Search Console Crawl Stats report. This update gives you data you can use to debug crawl issues and check the health of your site.
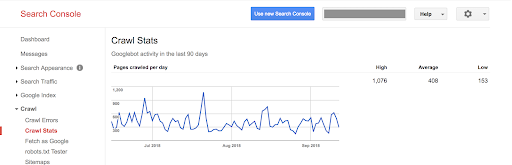
The previous version only indicates the number of pages crawled per day, kilobytes downloaded per day, time spent downloading pages by day.
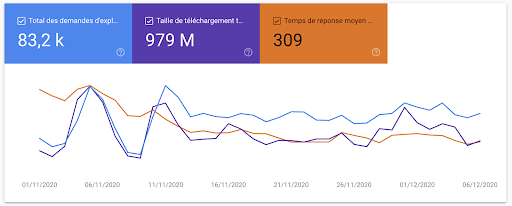
With this new version, the same information is available with an updated look and feel to match the rest of the Search Console:
But it doesn’t stop there. Google provides much more information about how they crawl your site. And with so much information available directly from Google, it begs the question: do we still need log files?
Let’s start by looking at the new report itself.
All you need to know about the Google Search Console Crawl Stats Report
Where can you find the new Crawl Stats Report?
The new crawl stats report is automatically available to anyone with a Google Search Console account.
Log in to the Search Console and navigate to “Settings” in the left-hand sidebar. Then click on “Crawl Stats”.
What’s in the new Crawl Stats Report?
To help you find your way in the extensive new information, we recommend Tomek Rudzki’s walkthrough on Twitter:
New GSC Crawl stats are awesome!
The first screenshot is similar to the previous version of the report, but there are hidden gems in other reports
1/n pic.twitter.com/oCNzMhnGsQ— Tomek Rudzki (@TomekRudzki) November 24, 2020
Tomek highlights new data and SEO use cases for each:
- Hosts with the most Googlebot hits: find the subdomains that are most frequently crawled by Google.
- Status codes returned to Googlebot: find out what percentage of your crawl budget is used by non-200 (that is: redirects, missing pages, and errors) responses.
- Type of file: understand how frequently Googlebot requests resource files like CSS files, JavaScript files, and images.
- The purpose of the Googlebot visit: learn whether Google is discovering new content or refreshing content it already knows about.
- The split between requests made by the smartphone Googlebot and those made by the desktop Googlebot: confirm whether your site is ready for the full shift to Mobile-First Indexing in March 2021.
- A sample of crawled URLs: get an idea of some of the recently-crawled URLs on your site.
- Host status: a new metric that shows if your server has had issues recently. For example, this takes robots.txt availability and DNS resolution into account.
Our top three favorite things about the Crawl Stats Report
There are too many benefits offered by the Crawl Stats Report to list them all, particularly if you don’t have access to logs files. But here are our top three:
1. This report is meant for everyone.
It provides easy-to-read, high-level Googlebot crawl stats. It’s clear when things are doing well, and when there are issues that might need to be addressed. In some cases, it goes even further: for example, it provides hints like the green/yellow/red status indicators for the host status.
Even if you’re new to bot and crawl budget tracking, you shouldn’t be lost when looking at these reports.
2. The documentation is great.
The documentation not only answers 99% of your questions, but it also gives best practices and tips for server health, red flags, crawl frequency management and basic googlebot wrangling.
3. Data on the “why” behind Googlebot requests
We can track Googlebot, but many conclusions as to why Google is visiting a page have to be drawn based on limited data. The Crawl By Purpose section and the rendering requests that are visible under “Page Resource Load” provide a non-ambiguous answer to some of our questions. We now know for sure whether Google is discovering a page, updating the page, or downloading a resource in a separate, second pass in order to render the page.
[Case Study] Managing Google’s bot crawling

What’s the difference between the information available in log files and the Crawl Stats Report?
Crawl Stats are limited to Googlebots
Crawl Stats: 0
Logs: 1
Your server’s log files record every request for any of the files and resources that make up your website, no matter who they come from. This means that logs can tell you about more than just Googlebot.
However, Google’s Crawl Stats Report is (naturally!) limited to Google’s own activity on your site.
Here are some of the insights you can get from log files that don’t show up in the Crawl Stats:
- Information about other search engines, such as Bing. You can see how they crawl your site, but also look at how their behavior differs from or aligns with that of Googlebot:
Logflare is so useful. Interesting to see different crawling behaviour of Googlebots compared with Bingbots in live logs. Googlebot sees 301 and then the next URL returned is the redirected to URL but Bingbot doesn’t seem to do that. Just sees the 301 and then goes somewhere else
— Dawn Anderson (@dawnieando) January 22, 2020
- Information about what tools (and competitors) are trying to crawl your site. Since the information available isn’t limited to Googlebot, you can also see if other bots are active on your site.
- Information about referring pages. This can help you find more information about your most active backlinks. In HTTPS, the last page visited, or the “referring page” is also recorded with each request.
- Information about organic traffic… and not just traffic from Google! Using referring pages, you can identify traffic from search engine results pages, and better see how these visitors interact with your site. This sort of information can be used to confirm or correct numbers provided by your Analytics solution, if you use one.
- Identification of orphan pages. Since your logs contain all URLs requested by visitors, any “active” pages with bot or human traffic that are not linked to in your site structure will show up in your logs. By comparing a list of URLs in your log files to a list of URLs in your site structure from a crawl, it will be easy to spot orphan pages.
Complete and up-to-date?
Crawl Stats: 0
Logs: 2
Is your data complete and up-to-date? Your logs are. And your Crawl Stats might be.
Many people quickly noticed differences of 20-40% between the Google Search Console report and their log files: the Crawl Stats report under-reports Googlebot activity at the moment. This is a known issue in the Crawl Stats—but not in your logs!
Additionally, like all information in the Search Console, there can be a lag between the last available date of data, and today’s date. So far, we’ve seen a difference of up to eight days in the Crawl Stats report.
On the other hand, you can use your log files for real-time monitoring: there is never a delay!
Aggregate vs full lists of crawled URLs
Crawl Stats: 0
Logs: 3
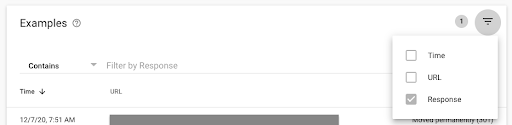
The Crawl Stats provide aggregated data for all of your URLs. The report is equivalent to a dashboard. When you go to look for the list of URLs behind a given metric, you’ll see a list of “examples”. For example, you might have a few hundred examples of your 4.56K requests for image files:
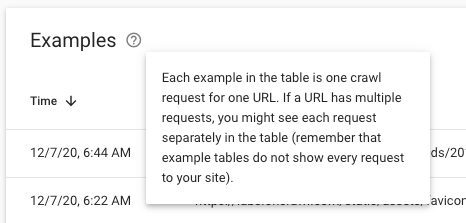
However, in log files, you have a full list of the URLs behind any metric. You can see ALL requests in your logs, not just a sample.
Filtering for regions, dates, URLs…
Crawl Stats: 0
Logs: 4
To be really useful, the Crawl Stats could benefit from broader filters that apply to all requests, not just the samples:
It would be great to have more flexibility to:
- Change the date range we’re looking at
- Focus on a given geographical region by IP lookup
- Better filter by URL groups
- Apply filter options to graphs
You can do all of this — and much more — in log files.
Googlebot-specific information
Crawl Stats: 1
Logs: 4
As we’ve seen, Google uses the Crawl Stats Report to provide information about the purpose of their crawl:
- Refresh vs Discovery
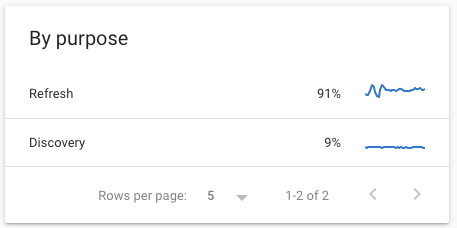
- Page resources (a secondary fetch)
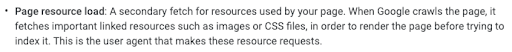
This information can’t be found anywhere else, no matter how cleverly you look at the data in your log files.
Easy access
Crawl Stats: 2
Logs: 4
Access to the Crawl Stats report is straightforward: Crawl Stats are automatically available to anyone with access to the Search Console.
Technically, log files should be available to any webmaster, too. But this often isn’t the case. Often dev teams, IT teams, or client companies don’t understand the importance of providing access to log files. In areas like the EU, where privacy laws restrict access to “personally identifiable data”, like IP addresses, access to log files can pose a legal issue. You can use certain tools, such as Oncrawl, which does not store sensitive information.
Once you have access to log files, there are free tools to analyze the data, and there are few proprietary formats. In other words, log files are a pretty democratic source of data… once you get your hands on them.
It’s a fact: many SEOs have trouble getting access to logs. So while, theoretically, log files provide easy access to data, the point on this one goes to the Crawl Stats Report, which is available in two clicks from Google’s free tool.
Oncrawl Log Analyzer

Not (yet) available for integration in other tools and analyses
Crawl Stats: 2
Logs: 5
Google Search Console allows you to export and download the information available via the web interface of the Crawl Stats Report. That means, however, that the downloaded information has the same limitations as the on-screen versions.
In addition, the Crawl Stats aren’t (yet?) available via the API, so it can be difficult to connect this information into automated processes for reporting and analysis, or even to back it up for a wider view of historical data.
With log files, storage, access and reuse are generally up to you. This makes log files much more easy to use when merging with other data sources like rank tracking, crawl data, or analytics data. They’re also easier to integrate into reporting, dashboarding and data visualization flows.
The final winner: log files!
With five points to only two points for the Crawl Stats report, log files are the clear winner here if you want full insights into how search engines interact with your site.
But let’s be clear: The upgraded Crawl Stats report provides a lot of new information: status codes, file types, subdomains (for domain properties), host status details, and more. It gives you more granular insights and actionable data to understand how your website is crawled and now, you can track changes in crawling patterns.
It will be a huge step forward for people who can’t get access to their or their clients’ log files.
However, it’s not all pros!
Pros & Cons of new GSC Crawl Stats: https://t.co/bjpG7QjeVt
Pros:
+Upgraded data metrics
+Better UX (low bar TBH)
+Downloadable data of URLs crawled!
+Crawl request breakdowns
+Important host issues notedCons:
-No filters for date ranges
-No filter options to change the graphs— Micah Fisher-Kirshner (@micahfk) November 24, 2020
The downsides to the new report is that, while it is a good dashboard for Googlebot monitoring and a great addition to complement log file analysis, it’s limited in many ways. Don’t forget, only your log files will show you all your requests per URL rather than an aggregate trend.
In addition, there is a known issue in the GSC report where some requests are not counted at the moment, and data can take–at the time of writing this–up to a week to appear in the Crawl Stats report. (However, we trust Google is working on these issues and they’ll soon disappear!)
Here’s what we recommend: use this report to know what exactly to look for in your log files. And then dive into your log analysis!