JavaScript and SEO have experienced a huge amount of change over the past year with search engines being better than ever before at crawling and indexing your content. With these changes, there is still the need to be able to diagnose common issues and answer the most common JavaScript SEO question: “can a search engine see this?”
In this post, I explore the process behind finding an issue using your browser and the free tools available to any user.
Rendered vs Source
A key part of diagnosing issues is understanding the difference between the first delivery of HTML and the rendered HTML.
The first set of HTML is raw HTML which hasn’t had any client-side scripts applied. This code is often much lighter, especially so within JavaScript framework websites where the majority of the work is done as the DOM loads in.
The rendered HTML is where the browser has started to run the client-side JavaScript and began to load in all of the content of the page.
We know that search engines are good at rendering JavaScript. This means if you are looking to audit a JavaScript heavy website, we would recommend the following process.
- View source first to understand what’s served by the initial set of HTML
- View the rendered HTML and understand how different the two things are
- If they are both similar we would recommend using Diffchecker to compare each piece of code to be able to visualise the differences.
- Note down the pieces of content that are heavily reliant on JavaScript to refer back to later.
Using Foot Asylum as an example, we can see where the COVID-19 message isn’t available in the source but is present when the DOM has loaded.
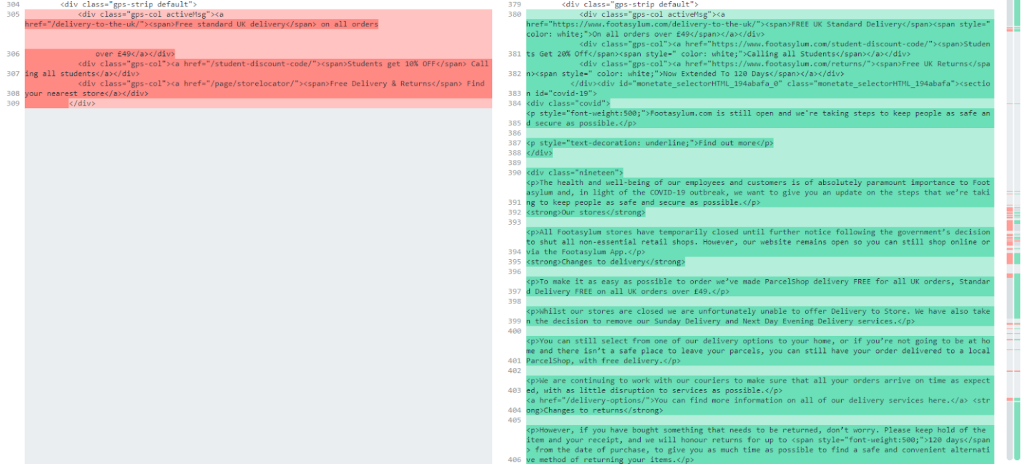
While this isn’t an error, it’s always good to get an understanding of what the JavaScript is doing when the code is rendered. At this point, we now understand which parts of the page are loaded in as the DOM completes.
Mobile-Friendly Test
The mobile-friendly test allows you to crawl your website with the full (almost) smartphone Googlebot to see if there are any rendering issues or code being missed out. We know that Google is great at rendering JavaScript but not perfect, so let’s continue to use the Foot Asylum example to understand how it’s being handled. Here we will look for the H2 tag which says ‘Shop the latest’.
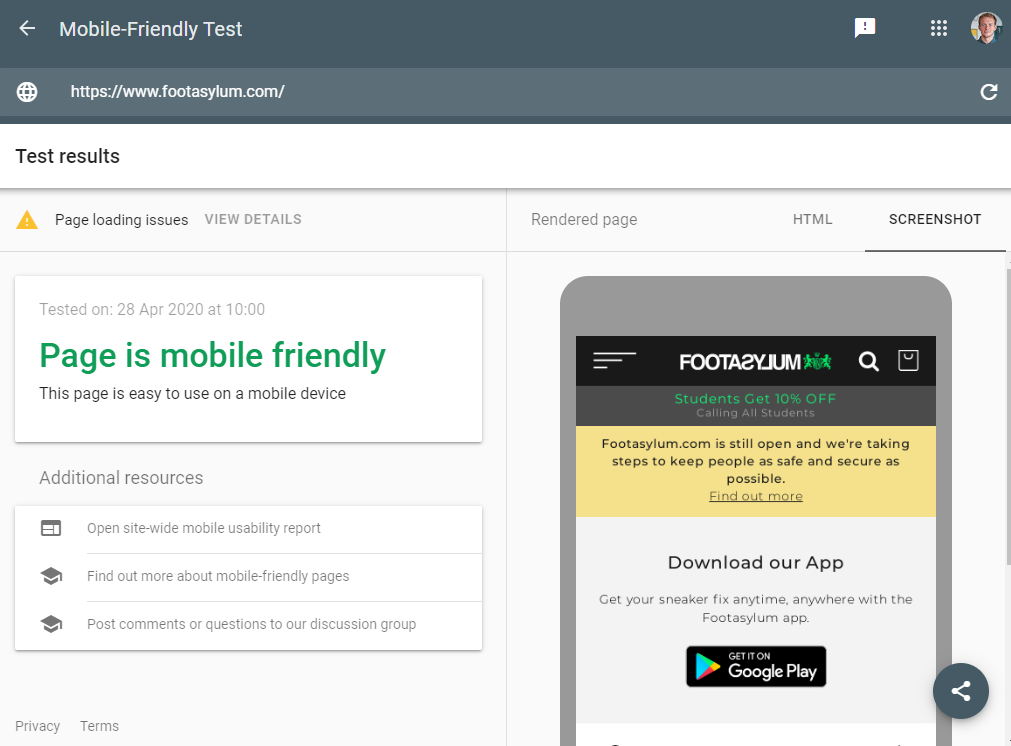
After running the website through the tester we can see the validation messaging on the left and the rendered website on the right. The first thing that jumps out is that the image in the tester doesn’t match what we see on a mobile device:


The tester is never perfect as it doesn’t seem to go through the full rendering process that the actual Smartphone bot would, so the next step here is to look at the code available within the mobile-friendly tester to see if the HTML has been picked up. Let’s look for this heading tag:

To do this, we can search the HTML returned in the tester for the text to see if it was picked up by the Smartphone bot:
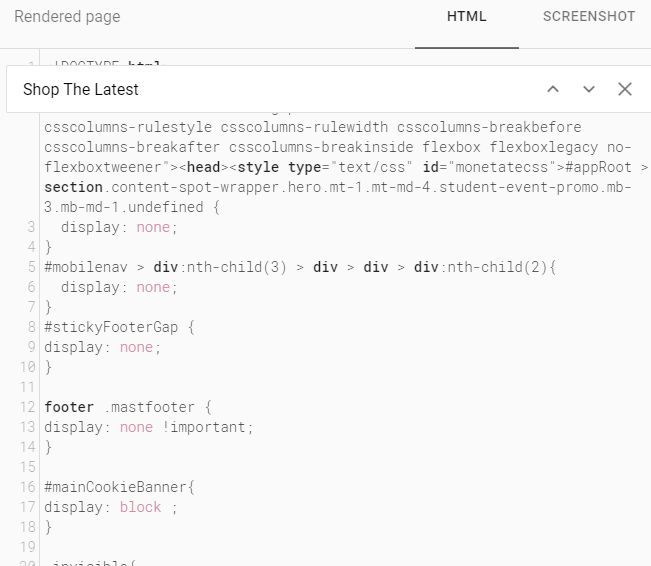
The content was not found in the mobile-friendly tester. This highlights that there could possibly be an issue with this content so we need to investigate further.
By looking at the cache, we can see if Google has managed to indexed this content:
cache:https://www.footasylum.com/mobile

Here we can see the content ready and in the index.
This highlights how this method isn’t foolproof as Google doesn’t seem to give anywhere near as much rendering time for JavaScript to fire than it would with a normal crawl, which makes sense as it would be costly to run this tool!
Search Console
Any page within a property you’re verified against can be tested within Google Search Console to see the code that’s in Google’s index. You can compare this against the rendered code from your browsers as well as the Mobile-Friendly Tester to spot any issues:
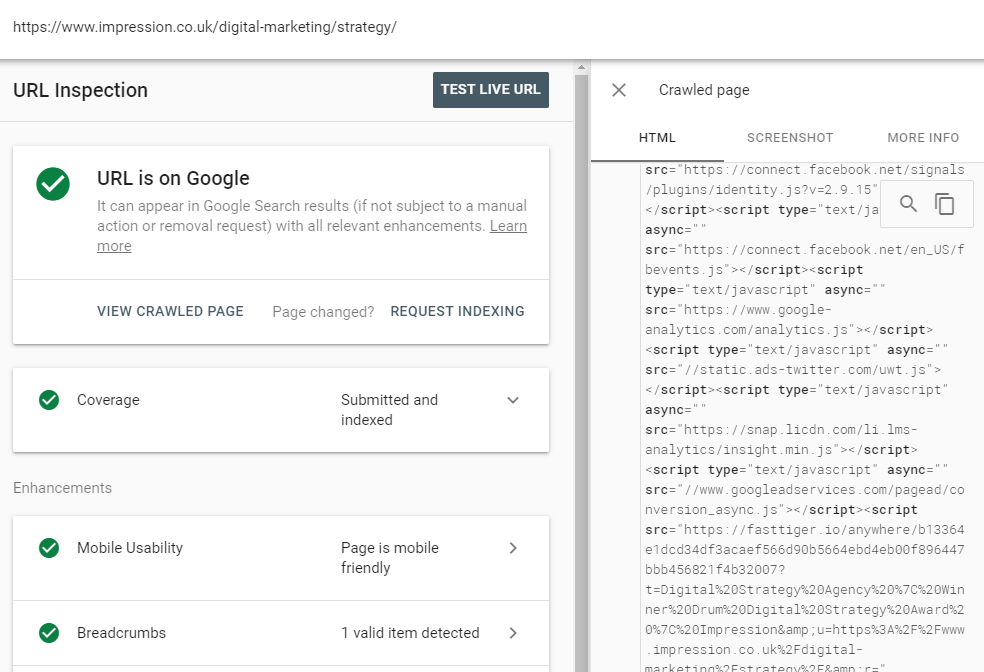
By clicking the ‘View Crawled Page’ button after inspecting a URL, you can open up the code which Google has for that page in the index. This allows you to look for pieces of content which are heavily reliant on JavaScript to understand if Google has indexed them.
Site: Operator Command
This is an awesome way to see if the content on the page has been successfully indexed where you don’t have to be verified in Search Console. If you take any page you’re looking to audit, you can add site: to the front of it and wrap the content you suspect of having issues in quote marks at the end. Let’s look for some content far down on our own About Us page.
site: https://www.impression.co.uk ‘supporting growth in our local community’

Below you can see the content has been pulled through from the page, from here it’s safe to say that this content is indexed and Google has been able to render it.
If you ever suspect that something isn’t indexed, then this is a really powerful way to check quickly.
[Ebook] Technical SEO for non-technical thinkers
Takeaways for JavaScript diagnostics
JavaScript is a complex subject with many facets. While many SEO’s aren’t comfortable with editing or implementing it, what we can do is make sure we understand how it impacts the websites we are working with.
- Source or rendered – This is a starting point to understand how reliant the site is on JavaScript
- Mobile-Friendly Tester – Allows you to crawl as the Smartphone bot would to see how Google understands the page.
- Cache: operator – This operator lets you see what Google have cached for the page. Here you can quickly see if there are pieces of content which haven’t been indexed by matching this to the page you’re seeing in the browser.
- Search Console – Lets you query what’s in the index to see if it’s seeing the same as users are.
- Site: operator – Allows you to quickly check if the content is in the index by checking suspect pieces of content within the SERPs.
Using the above methods, you should be able to audit any JavaScript website and be able to spot any issues with how the content can be understood by search engines.

