In the world of technical SEO, Core Web Vitals can be one of the hardest metrics to improve, especially if your website uses a large amount of JavaScript.
JavaScript is used across the web to create interactive and dynamic content and it’s estimated that up to 97% of all websites use JavaScript in some form. The trouble is – JavaScript can be resource-heavy to load, increasing First Contentful Paint (FCP), Largest Contentful Paint (LCP) and Total Blocking Time (TBT).
By the end of this tutorial, you will be able to identify what JavaScript files are having a significant impact on load times and how optimizing their execution is one of the most effective ways to improve performance and appease the Core Web Vitals report.
A brief introduction to JavaScript and the impact it has on load times
JavaScript is a versatile programming language that can be used in a variety of different applications, as it is native to a web browser, JavaScript is most known as a web-based language that can be naturally understood by web browsers.
Developers typically use JavaScript to create complex web-based games and applications as well as dynamic, interactive websites. Because of its versatility, JavaScript has become the most popular programming language in the world.
Before JavaScript, websites could only be built using static HTML and CSS, which meant they couldn’t be dynamic. Now, nearly every website on the internet is created using at least some elements of JavaScript to serve dynamic content such as;
- Dropdown ‘hamburger’ menus, showing or hiding certain information
- Carousel elements and horizontal scrolling
- Mouse-over and hover effects
- Playing videos and audio on a web page
- Creating animations, parallax elements and more
What impact does JavaScript have on SEO
Heavily relying on JavaScript can make it more difficult for search engines to read and understand your page. Although the most popular search engines have made drastic improvements to indexing JavaScript in recent years, it remains unclear if they can fully render JS.
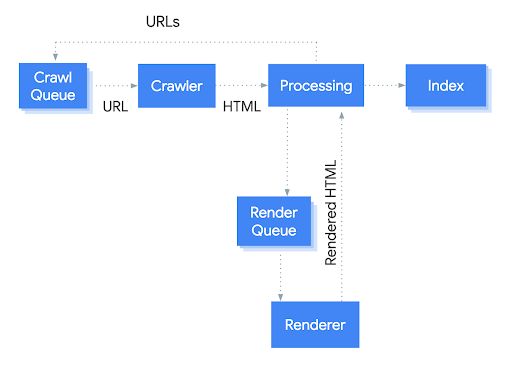
To understand how JS affects SEO, it’s important to understand what Googlebot does when it crawls a web page. The 3 steps it takes are; crawl, render and index.
Firstly, Googlebot has a list of URLs in a queue. It crawls these pages one by one and the crawler makes a GET request to the server, which sends the HTML document.
Next, Google determines what resources are needed to render the content of the page, usually, this only needs the static HTML to be crawled, not any linked CSS or JS. This helps reduce the number of resources Google needs, as there are hundreds of trillions of web pages!
Rendering JavaScript at this scale can be costly due to the amount of computing power needed. This is the exact reason why Google will leave rendering JavaScript until later when it is processed by the Google Web Rendering Services.
Finally, after at least some of the JS has been rendered, the page can be indexed.

Googlebot crawl process
JavaScript can affect the crawlability of links, within their guidelines, Google recommends linking pages using HTML anchor links, with descriptive anchor text. Despite this, studies have suggested that Googlebot is able to crawl JavaScript links. However, it’s definitely best practice to stick to HTML links.
Many technical SEOs believe it is best practice to use JavaScript sparingly and to not inject written content, images or links using JS as there is a chance it will not be crawled, or at least, not as often, because if a page is already within Google’s index then chances are, it will render it’s JavaScript much less often than a brand new page.
How to inspect JS load times on your site
To check the impact JavaScript is having on your load times, you can fire up PageSpeed Insights for a top-level view.
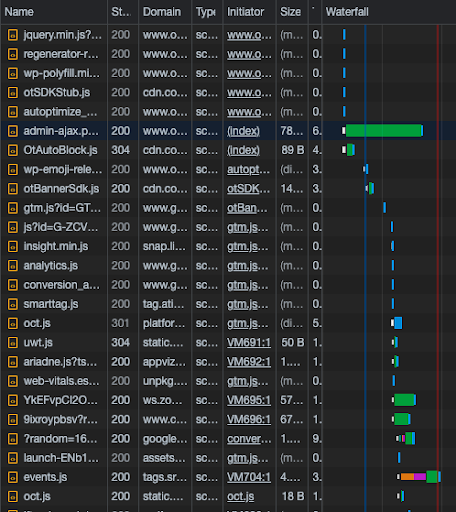
But, to identify the specifics and which elements are having a direct impact on loading times, you need to use a waterfall graph, such as the network report on Google Dev Tools.

Google Dev Tools Network Report
You can filter the report to just show JavaScript by clicking the ‘JS’ filter button, the resulting graph shows a clear indication of what files are taking the longest to load on your website.
From here, you know what elements need to be looked into and depending on the purpose of the script, whether its first/third party or above the fold, you can take the right action to optimize the JS and speed up its performance.
The different methods to improve JavaScript load times
If you have ever run a website through Google’s PageSpeed Insights, then chances are you have seen at least one recommendation regarding JavaScript.
Depending on how heavily your website relies on JavaScript, you can check by disabling it in your browser and seeing how different your website looks. If you notice that a lot of JavaScript, such as content and images is served dynamically, and no longer visibly when JS is disabled, then you should consider serving this using HTML and CSS.
There are multiple considerations to take as search engines do not always render JavaScript when crawling websites, so chances are, a lot of your content might not be crawled as often, and so you see slower indexation of your content.
That being said, every website needs to use at least some elements of JS, and there are multiple ways you can speed up its load times.
[Case Study] Optimize links to improve pages with the greatest ROI
Defer JavaScript
The defer value can be added to JS scripts so that it is executed after the document has been parsed, however, this only works with external scripts, when the src attribute is indicated in the <script> tag.
This declares to web browsers that the script will not create content, so it can parse the rest of the page. This means that when using the defer attribute, the JS file does not cause render-blocking to the rest of the page.
If defer JavaScript is used, it tells the browser not to wait for the script to load. This means that external scripts, that could take a while to load, will only be processed once the whole document is loaded beforehand. This allows for the processing of HTML to continue without having to wait for JS, thus increasing the page’s performance.
The defer attribute can only be used on external scripts, and it cannot be applied to inline code, this is because the defer attribute is similar to an asynchronous process, so web browsers can move to another task even when the first isn’t completed.
Minify JavaScript
Minification of JS code is the process of removing unnecessary characters from the code, without impacting its function. This involves removing any comments, semicolons and whitespaces as well as using shorter names for functions and variables.
Minifying JavaScript results in more compact file size, increasing the speed at which it can be loaded.
However, minification of any code, including JavaScript, can result in complicated scripts becoming broken. This is due to site-wide or common variables that can result in difficult-to-solve bugs. When testing JS minification, it’s vital to test thoroughly on a staging environment to check and fix any issues that appear.
Remove unused JavaScript
Two main types of unused JavaScript can cause render-blocking on your website; non-critical JS and dead JS.
Non-critical JavaScript refers to elements that are not needed for above the fold content but are being used elsewhere on the page, for example, an embedded map at the bottom of a page’s content.
Dead JavaScript refers to code that is not being used at all anymore on the page. These could be elements from a past version of the website.
You can identify where unused JavaScript is being loaded on your website using a waterfall chart, such as the coverage tab on dev tools. This will allow you to notice what files are causing render-blocking, if they are not needed and can be removed from your website.
Delay JavaScript execution
One of the easiest and most effective ways to improve loading times is to use the JavaScript delay function.
Using this function, you can prevent JavaScript from loading until the user interacts with your page, this could be a scroll or click. Once the user does interact, then all the JS is loaded inline.
Delaying JS execution is a great way to improve Core Web Vitals, such as LCP, FCP and TBT. But, it should only be used if there is no shift caused to the layout of your page when JavaScript is loaded upon interaction, as this could cause layout shift and a poor user experience.
Keeping track of JavaScript
The best way to reduce the load time of JavaScript is to use as little as possible!
Certain third party elements, such as visual tracking software can have a significant increase in load times, and if that data is no longer needed, then remove the tracking code!
When you, or developers, are making a significant design change to the website (such as an interactive map) it will save you countless hours to consider load times beforehand, and make the element load as fast as possible before implementing it on the website.
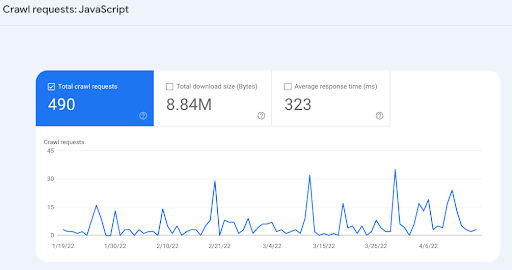
To keep an eye on how much Googlebot is crawling JavaScript on your website, you can navigate to the crawl stats report in Google Search Console, where it will show how many crawl requests, total download size and the average response time.
This report is super helpful, especially if you have been optimizing JS to see the actual impact it is having on Googlebot.

JS Crawl requests
Key Takeaways
- If you don’t need a certain JS file on your site – remove it!
- If you can, defer third party JS as much as possible.
- Minify & delay execution of first-party JS without breaking functionality.
- Test everything on a staging site first!
By understanding the impact JavaScript has on load times, you can address it (hopefully) without breaking the website. It’s vital to remember that user experience comes first, and if you are damaging the website’s conversion rate by removing a certain JS file, just to increase load times by 0.2s then you need to evaluate the wider impact it has.
But get out there, use a staging site, and see what you can do to make those pesky JS files load quicker!

