This article is a follow-up to the first part in which we looked at what exactly TTFB is and why it’s important for SEO. Part one also took an in-depth look at what determines your TTFB score and which steps you can take to improve it.
Part two of the article will be more focused on measuring your TTFB score. Although a number of tools exist to do so, we would like to provide a detailed how-to guide for Chrome’s Devtool and with Webpagetest.org.
Tools to measure TTFB
There are many tools you can use when it comes to measuring the TTFB metric, all of which are free and relatively intuitive to use:
- Webpagetest.org
- Chrome Devtools
- Google Lighthouse
- Google Pagespeed
- Gtmetrix
- Bytecheck.com
My personal favorite is webpagetest.org as it allows you to visualize a lot of details related to your web site’s technical performance. I’ll walk you through how to use it as well as Chrome’s Devtool.
How to check TTFB with Chrome’s Devtool
- To view the TTFB score in Chrome Devtools, first navigate to the page you want to measure in the browser. Then, right-click on any blank area on the page and select “Inspect”.
- Once you select “Inspect”, Devtools will open, and at the top of the page, you will see a page with various sections including elements, console, network, and other page-related data.
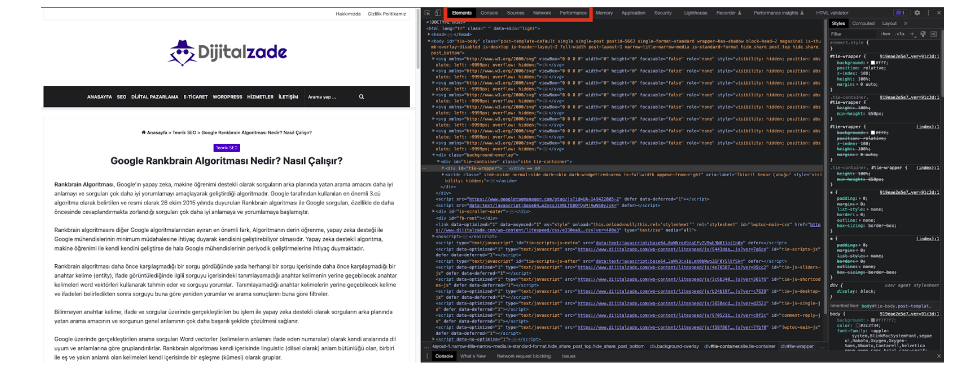
3. To view the TTFB metric, click on the “Network” tab as shown in the image below. After that, press CTRL+R to reload the page and view the network requests.
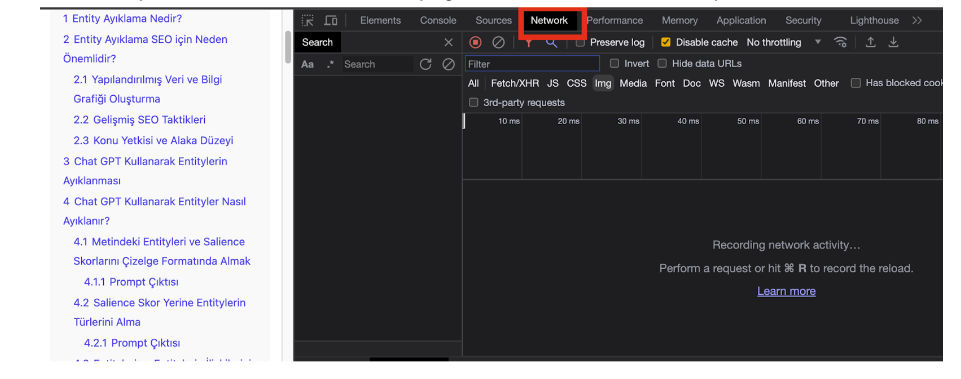
4. Once the requests are loaded, you can view all network resources (HTML, CSS, JS, etc.) that were called on the page.
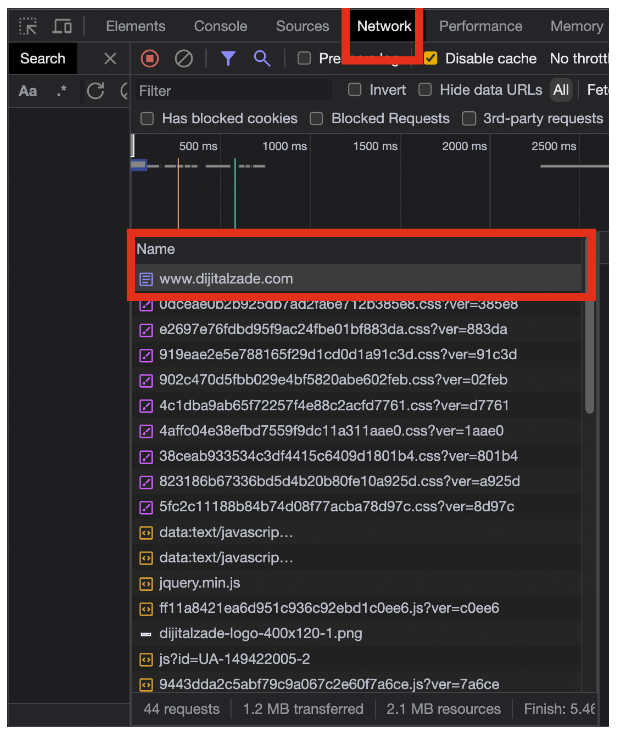
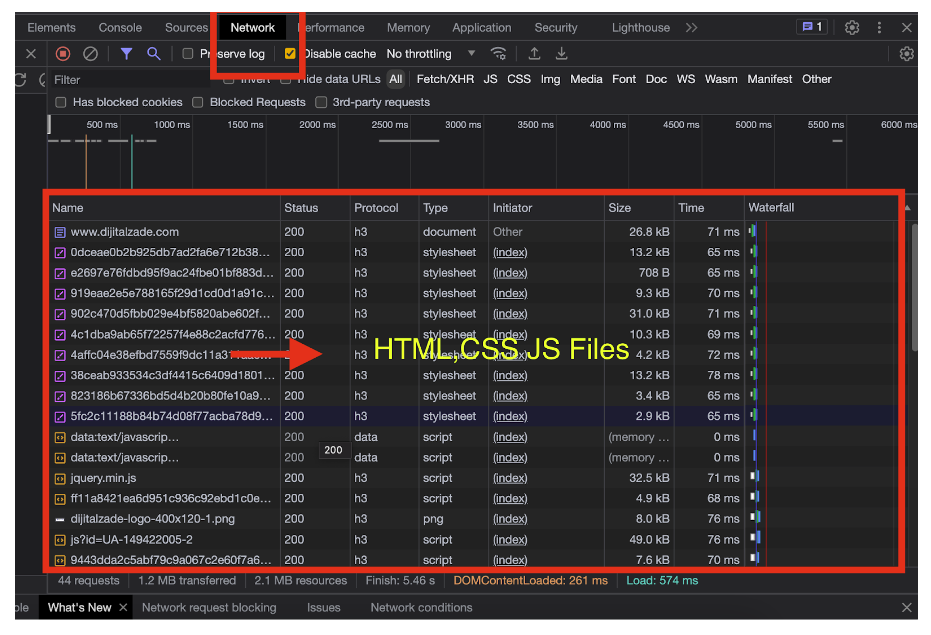 5. After viewing the network request files, click on the resource that contains the name of the page you requested.
For example, in the image below, the “www.dijitalzade.com” resource is listed at the top requests. Click on the resource that corresponds to the page you requested. The page name will be listed at the top of the list).
6. Once you click on the page resource, a new screen will open on the right side of the page displaying headers, preview, response, initiator, timing, and cookies options.
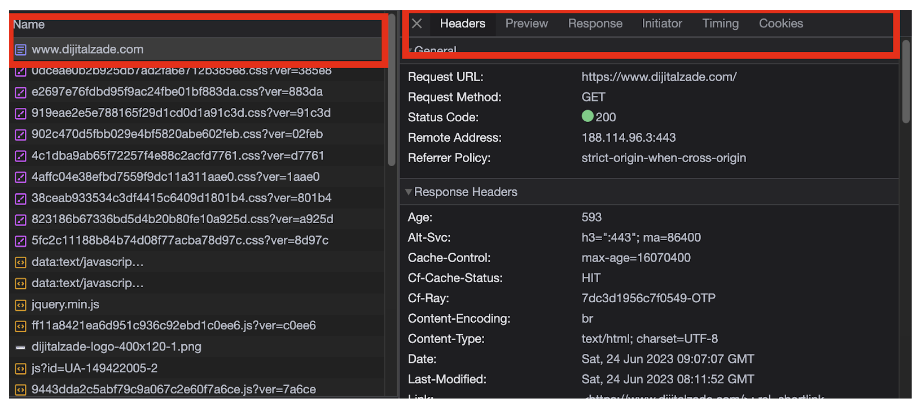
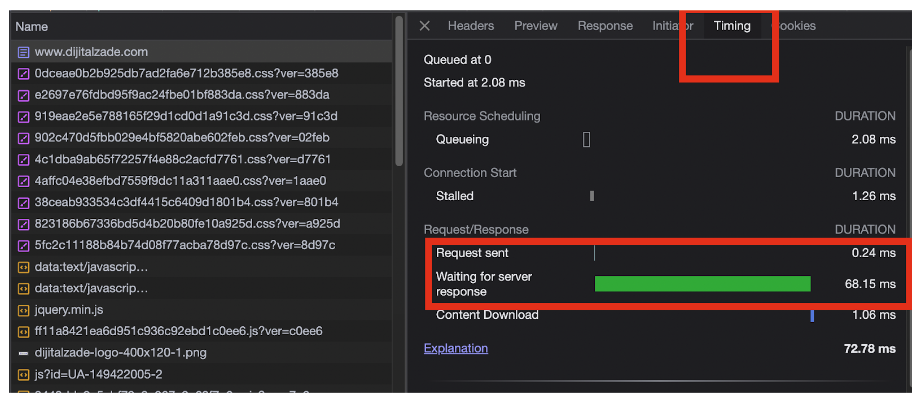
7. To view the TTFB metric, click on the “Timing” option. The TTFB for the selected page will be displayed in milliseconds at the bottom of the screen.
How to check TTFB with Webpagetest.org?
I prefer Webpagetest.org because it allows users to test the performance of their websites from multiple locations around the world. In addition to TTFB, it provides metrics related to visual completeness and fully loaded time.
Users can select a browser and location for the test and the tool will generate a detailed report that includes waterfall charts, screenshots, and other useful information about how the webpage loads and where potential bottlenecks might be.
To do a performance test on webpagetest.org follow these steps.
1. Open your web browser and navigate to www.webpagetest.org. Then, enter the URL of the website you want to test in the dedicated box. This could be the homepage of the website or any other page on the site.
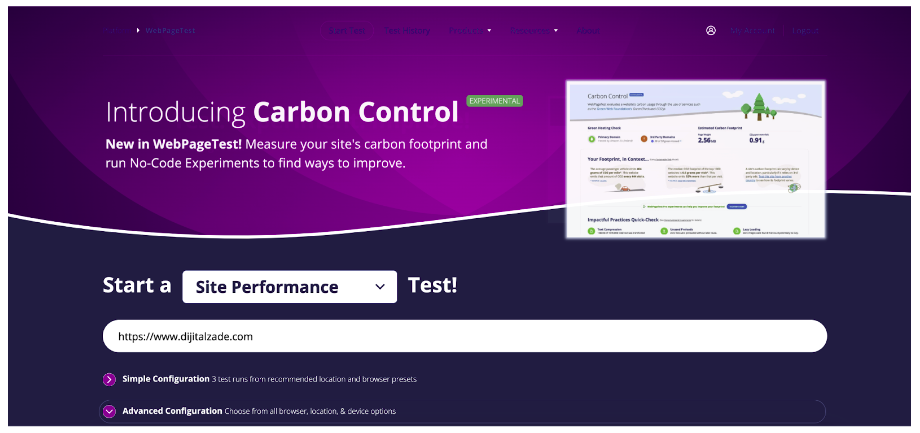 2. After you enter the URL that you want to test, under ‘Advanced Settings’, you can choose various test conditions, such as connection speed, number of tests to run, browser, test location etc. The default settings are usually sufficient for a basic test, but these can be modified based on your specific requirements.
To have the most accurate results, I recommend filling in the advanced configurations.
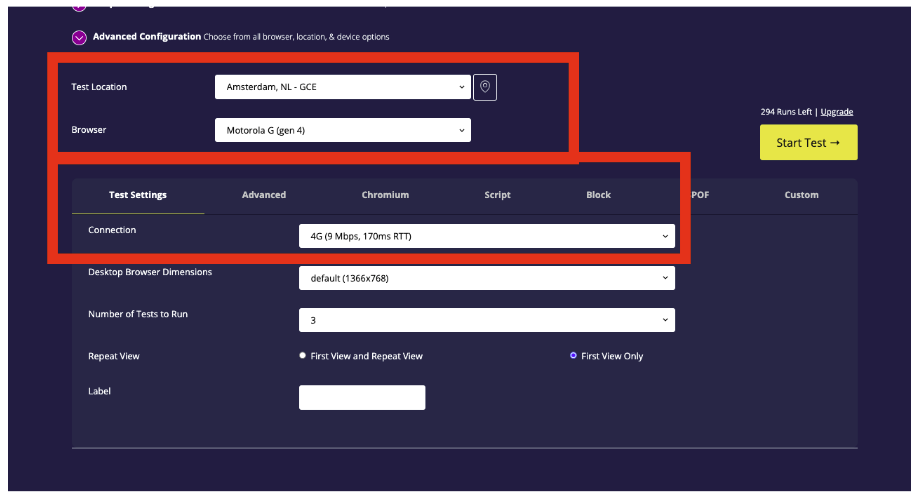
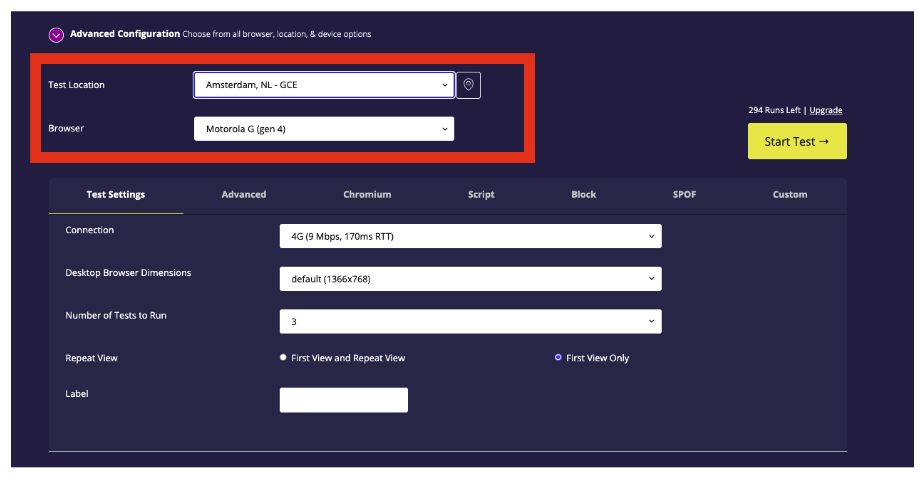
3. In the ‘Test Location’ dropdown menu, select the location from where you want the test to be conducted. This should ideally be a location that is representative of where most of your site’s traffic comes from.
In this example, we chose Amsterdam for the test location.
Next, select the browser on which you want to test. Different browsers can load web pages at different speeds, so it’s a good idea to test the browsers that your audience uses the most.
In order to have similar test results to Google Pagespeed lab data and Lighthouse, we have chosen Motorola G (Gen 4) as the browser device.
 4. Next, you will select the internet connection speed. In the ‘Connection’. drop-down menu, you can select from Cable connection, Mobile 3G, Mobile 4G, or DSL. Select the one that best represents the typical connection speed of your website’s users.
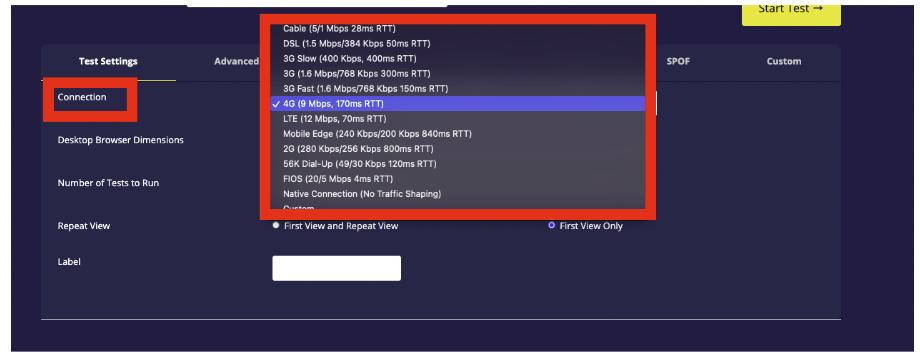
To have similar test results to Google PageSpeed lab data and Lighthouse, select 4G (9MBPS) as the connection speed. Google PageSpeed and lighthouse tools use a slowed down 4G speed when doing speed tests. For this reason, this is the closest speed option on webpagetest.org.
5. Click on the ‘Start Test’ button. The test may take a few minutes to run.
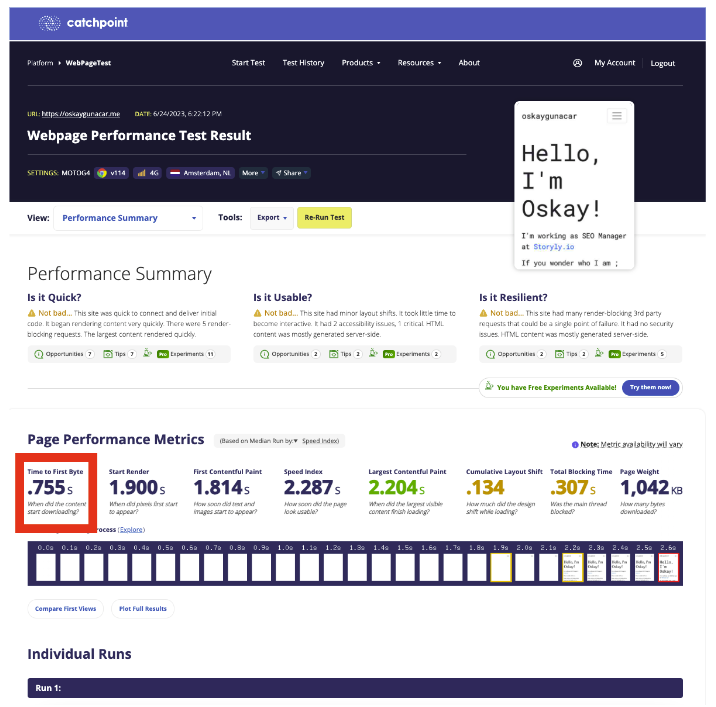
6. Once the test is complete, you’ll be presented with a results page that includes a variety of information about the page’s load time and performance. This includes a ‘waterfall’ chart of all the elements on the page and how long they took to load, a visual comparison of how the page loaded, and various performance grades.
In the advanced configuration settings, if you select a different internet connection, different location, or even different browser settings, then the test results, especially the TTFB results will vary.
Conclusion
As you have seen throughout these two articles, we have delved into what TTFB is, its relevance for SEO, what steps can be taken to enhance it and we provided a practical approach focusing on how to measure your TTFB score effectively.
Specifically, we explored two popular tools for TTFB measurement – Chrome’s Devtool and Webpagetest.org. We provided a step-by-step guide to utilizing these tools to measure and understand the TTFB score of your webpages. We particularly highlighted the flexibility and detailed insights offered by Webpagetest.org, which enables you to check your website’s performance from multiple global locations using different browsers and connection speeds.
Remember that optimizing TTFB is not a one-off process but a continuous one, as new content, features, and updates may affect your site’s performance. Regular checks and adjustments will help maintain your website’s health and ensure a smooth user experience, which is vital for your SEO success.

