
While there is no debate about the positive effect of load speed on UX and conversions, there is a lot of discussion about SEO, especially since the announcement of Page Experience Update and Core Web Vitals.
The quality and relevance of the content are still the criteria that prevail to rank a page in the SERP, and the speed can be used as a tie-breaker to decide the ranking between two equivalent pages.
It is also a quality that is highly appreciated by Google’s robots, which favor the indexing of fast pages. We have been observing this phenomenon for several years now, for example at Rue Du Commerce, which has seen the number of crawled pages increase after optimizing its frontend; or at TUI, which has optimized its crawl budget by improving the display speed of its pages.
For your visitors as well as for your SEO, the necessity and the impact of fast pages are undeniable. But to get started with the right tools, you need to know what you want to measure, why, and how. Here are some keys.
What metrics for page speed?
Defining a Performance Budget is an important step that will allow you to specify your performance objectives and set limits. These can be objectives in terms of page weight not to be exceeded, indicators or webperf scores to be reached…
You will see – or you may have already noticed – that there are many metrics and performance scores. Among the most well-known metrics “historically”, we find for example :
- the Speed Index, which evaluates the loading speed of the elements in the viewport ;
- the Time To First Byte, which indicates the server response time, well known in SEO since Google already took into account before Page Experience Update;
- Start Render and First Contentful Paint, the moment when the browser displays the very first elements on the page;
- Time To Interactive, which evaluates the time it takes for a page to become interactive in a sustainable way and without latency…
Metrics are evolving, new ones are appearing regularly to better measure the user experience (for example, a metric is currently being studied to evaluate fluidity).
Google has put 3 webperf metrics in the spotlight with the Core Web Vitals, to evaluate the quality of the UX:
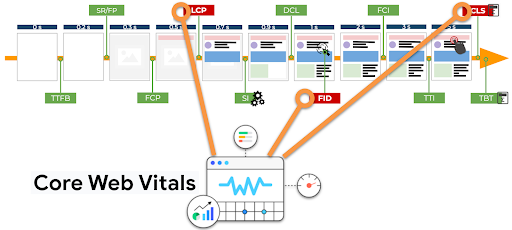
- the Largest Contentful Paint, to measure the display speed of the largest element on the page,
- the First Input Delay, to measure the reactivity of a page following a user interaction,
- Cumulative Layout Shift, to measure visual stability.
LCP and FID are calculated in milliseconds, while CLS is a score.
There are many metrics (and you can even introduce your own business-oriented metrics, related to specific features of your page, using Custom Metrics), so before you get started, you need to determine :
- what you want to measure,
- where you are starting from,
- what you want to achieve.
Be careful about the metrics you choose and the goals you set: don’t give in to the temptation of vanity metrics!
As in SEO, you want to improve your site’s experience and loading speed for your users first, not just to fill up dashboards with numbers and scores.
Here’s a first step to help you frame your goals in business terms: you can test the ROI of faster pages with Google’s Test My Site.
This free tool shows you how much more revenue you could generate by speeding up your pages. Even if the data is an estimate, it is meaningful and useful to set a first goal.
Which tools to measure the loading speed?
After having seen some of the essential webperf metrics to know, here are some suggestions of tools to collect them.
WebPageTest, a free reference tool for the webperf community, allows you to visualize the loading stages of each element of the tested page over time.
Dareboost, GTMetrix, Pingdom, SpeedCurve or Quanta are paid tools that also allow you to evaluate the loading speed and performance of your site.
Google also offers free tools, some of which you probably already use or have heard of.
Let’s mention in particular PageSpeed Insights and Lighthouse which indicate performance scores, and which allow you to evaluate your Core Web Vitals (to understand how they work and the results, you will find detailed explanations here for PageSpeed and here for Lighthouse).
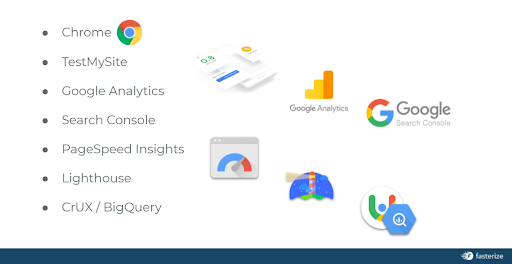
Let’s go further about Core Web Vitals with this list of tools to measure them, from the less technical to the more expert: Chrome, Test My Site, Google Analytics, Google Search Console, PageSpeed Insights, Lighthouse, and CrUX / BigQuery.
As you can imagine, your KPIs must be monitored over the long term to measure the impact of the optimizations you deploy, and also to detect any regression.
Yes, another parallel between SEO and webperf: it’s a long term work (good news: frontend optimization can be automated and therefore continuously improved in a way that is sustainable for technical teams).
To be able to react quickly in case of problems, you can set up an alert system and detect anomalies in real time – for example, using tools such as SpeedCurve or Dareboost.
These regressions can occur as a result of a bug, the deployment of a new feature, the evolution of the site… Any change can have an impact on your loading speed, which is why webperf requires constant attention from all teams.
In case of a drop in performance, or even unavailability of your pages in the worst case, the consequences for your turnover can be disastrous, especially during periods such as Sales, Cyber Week, Christmas… Let’s take the example of Amazon, which suffered a loss of $99M in 2018, due to an unavailability of 63 minutes during the “Prime day”. You obviously don’t want that to happen to you, which is why tracking and continuously improving your web performance is crucial.
After the metrics and tools that allow you to evaluate your performance, let’s look at one last important point to properly define and understand your KPIs: the test conditions.
Understanding test conditions: a prerequisite for understanding your web performance KPIs
Just as not all Google users have exactly the same search results for the same query, not all your users have the same experience on your site.
We have seen that you can measure speed from different angles (display, interactivity, visual stability, server response time…), and it is also important to know that all these aspects of loading speed are influenced by different factors: the power and quality of the network, the power of the visitor’s device… Moreover, the display of the content varies according to the screen size.
CQFD: there is no single indicator that reflects the speed of loading your pages for all your users.
This is an essential notion to keep in mind, because it will help you put into perspective the metrics you collect, and define the conditions under which you test the speed of your pages.
To begin with, you should know that there are 2 methods to measure the loading speed:
- Synthetic Monitoring, which consists in defining test conditions (device, network, browser…) to collect data in a laboratory environment.
This is what Google calls Lab data in its tools, and it is also with this type of data that it calculates the PageSpeed Insights score, by simulating a navigation on a mid-range mobile in “Slow 4G”. You will understand why these scores may not represent the browsing experience of the majority of your users, as they may have better performing mobiles and better network quality. - Real User Monitoring (RUM), which collects field data from real users. This is the method Google uses to deliver what it calls Field data, based on its “CrUX” (Chrome User Experience Report) user panel.
If you are using PageSpeed Insights, you will probably have noticed a difference between Field data and Lab data, and now you understand why: they are not collected under the same conditions.
You may also have noticed that some data is available in one of the categories, and not the other. Why is this? Simply because some of them require navigation by a real user. Let’s take the example of the FID in Core Web Vitals: it is a data only available in Field data, because it requires user interaction. For Lab data (and for the calculation of Lighthouse and PageSpeed scores), FID is replaced by an equivalent metric: Total Blocking Time.
But then, Synthetic or RUM, Field or Lab, how to choose?
Choose data from Real User Monitoring (or Field data) to prioritize your front-end optimization efforts. They reflect the experience of your site’s users in real conditions.
As for Lab data, it will help you identify improvements that are still needed for your pages, and to test your performance by defining the navigation conditions yourself. They are also useful to follow the evolution of your performance over time in these conditions, and to compare yourself with the competition on your market.
In short, the tools to measure the loading speed are numerous and easily accessible, it is up to you to define the course and the stakes!
Also, before starting your webperf project, some strategic questions should be asked. For example: beyond knowing if it is realistic, is it desirable to have a PageSpeed Insights or Lighthouse score of 100? What is your objective behind wanting to have the 3 green Core Web Vitals?
Finally, knowledge of the different metrics, but also an understanding of the measurement methods and scores are essential to effectively monitor your performance. Beyond KPIs and reporting, it is up to you to make them relevant decision support tools, according to your technical and commercial objectives.
Don’t hesitate to let webperf experts guide you to remove any doubts and choose the right tools and metrics!
