In any strategy focused on search engine optimization (SEO), data analysis is essential. There are more and more specialists in this field who choose to develop their careers in the analysis of organic search traffic, which in itself has a behavior and particularities quite different from the rest: paid search, email, organic social, direct, etc. In this sense and thanks to a wide range of tools available today, this kind of studies have managed to evolve to an unthinkable degree compared to just a few years ago.
This major step forward is mainly due to the appearance of new methodologies and developments that have allowed us to generate analytical models without having to rely on complicated mathematical operations. We are lucky to have at our disposal the techniques and algorithms already tested and ready to start working with them.
In the article below, we are going to focus on the creation of a predictive model for a set of data of a time series where the calculated trend is adjusted to seasonality and previous periodicity. More specifically, we will be predicting the organic search traffic of our property from Google Analytics 4 (hereafter GA4). There are many options to carry this out, however for this particular case I have decided to execute the development entirely in Python.
The script on which this article is based consists of three clearly differentiated parts:
- Data extraction. How to use the new GA4 API step by step to collect organic search traffic.
- Data modeling. Use of Prophet, Facebook’s open-source library to make time series predictions.
- Data visualization. Show trend changes and modeled prediction.
GA4 Data Extraction Through Its API Using Python
The first thing we need to know when we are dealing with Google Analytics Data API (GA4) is that GA4 is its development status. As detailed by Google on its page, it is currently in an early-stage version. Specifically, as of the date this article was written, it is still in Beta phase.
It should be noted that GA4 was published on October 14, 2020. Only a few months have passed. In fact, those who already had a Universal Analytics property and who create a new GA4 one will be able to continue using both versions side by side, without any restrictions. It is not known for sure when the Universal Analytics properties will stop working. In any case, my recommendation would be to create a new property of type GA4 as soon as possible. This way you will have a broader data history. It should also be considered that each day that passes GA4 integrates new functionalities or improves existing ones. At the moment it is in constant evolution.
Because of this, of course there may be small changes in the code described below. Although for sure, they will be minimal. As an example, I’ve already encountered minor trifles such as renaming the field “entity” (Alpha phase) as “property” (Beta phase) within the class RunReportRequest().
First and foremost, before building the API request, an understanding of what elements are available is needed. Basically, it is all about following the structure below:
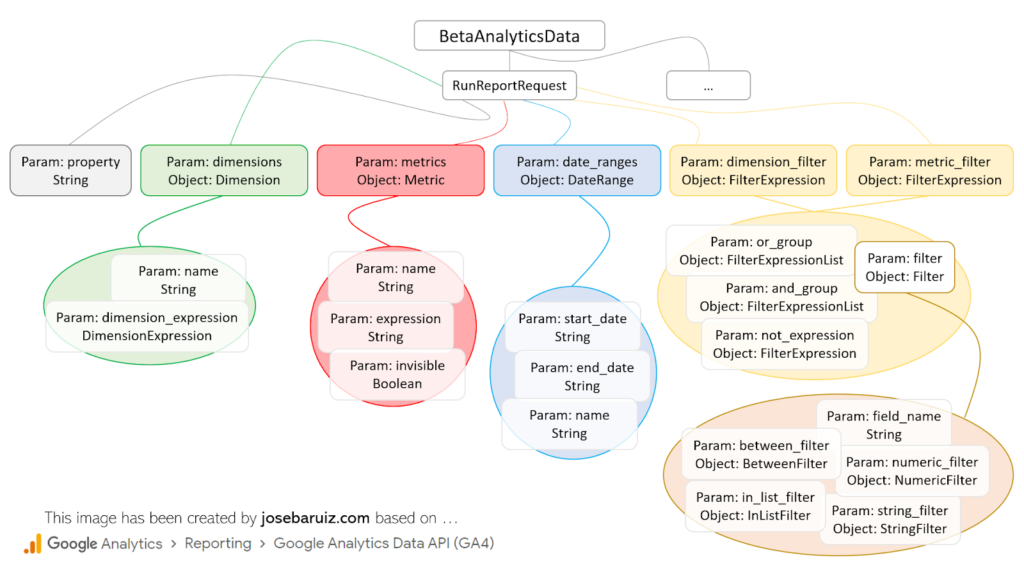
Types for RunReportRequest of GA4 Data v1 Beta API
At first glance it is quite intuitive, although the reality is quite different. To make a request, it is necessary to always have at least the following documentation at hand:
This is simply because the field names vary slightly from the official documentation, which represents the fields in JSON format. An example is the field fieldname of the Filter class. In Python we should describe it as field_name. A good general rule will always be to go from a camel case type field (like “fieldName”) to a snake case (like “field_name”).
Before continuing, let’s pause for a moment to initialize our project. As in the vast majority of cases when developing scripts in Python, we have to spend some time importing the necessary libraries and preparing the execution environment.
- Create a new project in Python. In this case, the PyCharm software has been used.
- Enable Google Analytics Data API in Google Cloud Platform and download the created service account file (JSON type) and save it in the folder where the Python project was created. On opening this file, the value of the client_email field must be copied, which will be something like name-mail@project-id.iam.gserviceaccount.com.
- Add this client_email value to the GA4 property from which the data will be extracted. You’ll need to do this in the user management section. At minimum, it will be necessary to grant it the permission level ‘Read & Analysis’.
- Through the client terminal (PyCharm) install the Google Analytics Data library in the project directory with which the API requests will be made:
pip install google-analytics-data
From here on, all you need to do is create the request, which, as you can see below, basically consists of three parts (client, request and response), and view or save the collected data.
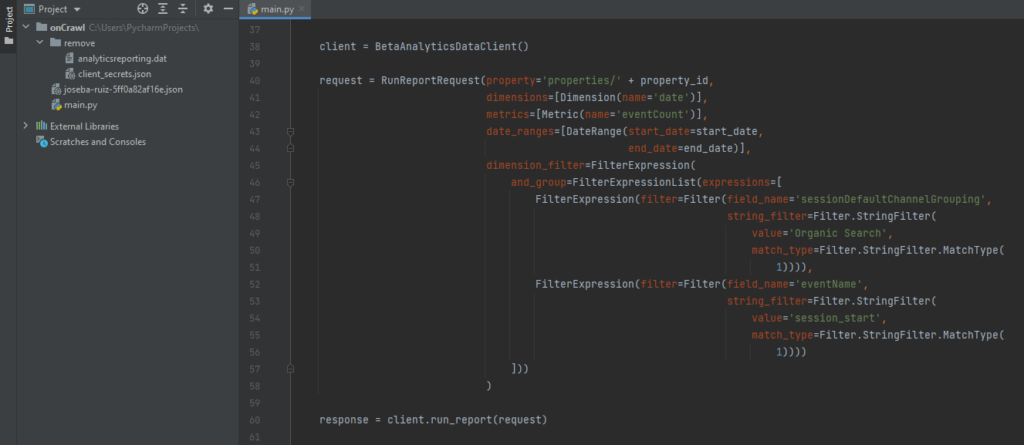
Code for making a simple request to GA4
Any dimension, metric, filter, data order, date range, etc. added to the request variable must be added as a class (see previous image “Types for RunReportRequest”) linked to a variable (metrics = [Metric (..)]). This makes it much easier to understand the structure of the data to be collected. In this sense, for each class of the highest level a specific import must be carried out. That is, if you want to add a dimension and a metric for a specific time range, at least the following objects will be required…
from google.analytics.data_v1beta import BetaAnalyticsDataClient
from google.analytics.data_v1beta.types import RunReportRequest
from google.analytics.data_v1beta.types import DateRange
from google.analytics.data_v1beta.types import Dimension
from google.analytics.data_v1beta.types import Metric
Of course, it is also possible to add specific values to certain variables (name = ‘eventCount’). For this reason, it is essential to understand and sink in the described documentation previously.
In addition to this, special attention must be paid to the variable os.environ [“GOOGLE_APPLICATION_CREDENTIALS”], which will contain the path to the file previously downloaded in step 2. This line of code will avoid some problems when managing the permissions to the Google API.
If the code has been executed correctly, you will see a result that looks like this: {Date, Events}, {20210418, 934}, {…}, ….
Data prediction through Facebook Prophet
Nowadays there are many free and existing options to carry out any type of prediction based on the data history. In this specific case I have chosen the Prophet library, but what is it really?
It is an open-source library (available for R and Python) created by Facebook’s Data Science team to estimate the behavior of a time series dataset based on an additive model where non-linear trends are adjusted to a daily seasonality, weekly and yearly taking into account the effects of vacation days.
Going back to the proposed implementation (organic search traffic prediction), the first thing to do is install the following libraries:
- Pandas (pip install pandas). Manage and analyze data structures.
- Plotly (pip install plotly). Creation of graphics of all kinds.
- Prophet (conda install -c conda-forge fbprophet -y).
Then, as always, you must carry out the imports associated with these libraries. After this, the only thing left for you to do is to perform the modeling of the prediction and its corresponding visualization. To do this, in the case of Prophet, you only must follow this process:
- Initialize a new Prophet object with the desired attributes to generate the prediction.
- Request the fit method, passing it the data extracted from GA4 as a dataframe. This request can take several seconds in some cases. The dataframe with the collected data must only consist of two columns whose names are always the same: ds (date type field) and y (metric to study).
- Create a new future dataframe setting the number of periods up to which the prediction should reach from the selected date range and the frequency with which the data will be aggregated (weekly, monthly, etc.)
- Request the predict method, which will assign each row of the new future dataframe a predicted value (yhat).
- Request the plot method to be able to view the generated predictions.
- Request the plot_components method which helps to visually understand the trend and seasonality of the data.
m = Prophet()
m.fit(df)
future = m.make_future_dataframe(periods=365)
forecast = m.predict(future)
m.plot(forecast)
m.plot_components(forecast)
plt.show()
Although the desired prediction has been generated in just six steps and it seems relatively simple, several elements must be considered that will be key to generating the prediction. They all affect the pertinence of the prediction in one way or another. In the end, it is about generating a prediction that conforms to the logic, in the case of this article, of our organic search traffic. For this, it is necessary to understand some more advanced settings of Prophet.
- Special days and vacations. There is the possibility of adding special days.
- Outliers. They must be eliminated if they affect the estimate.
- Changepoints. Detection of trend changes over the analyzed time.
- Diagnosis. Validation based on the measurement of the prediction error according to the historical study of the data.
- Increase. Selection between linear or logistic.
- Seasonality. Choice between additive or multiplicative.
All this and many more options are perfectly detailed in this documentation of the Prophet library.
Creating the complete script to be able to visualize the traffic prediction
All that is left now is to join all the pieces of the puzzle in a single script. The usual way to tackle this type of puzzle is to create a function for each of the previously detailed processes, in such a way that they can be executed in an orderly and clean way:
def ga4(property_id, start_date, end_date):
[…]

def forecasting(dim, met, per, freq):
[…]

if __name__ == "__main__":
dimension, metric = ga4(PROPERTY_ID, START_DATE, END_DATE)
forecasting(dimension, metric, PERIODS, FREQ)
Before visualizing the final result of the prediction, it is a good idea to look at the analyzed organic search traffic.
At a first glance, you can see how the different strategies and actions taken have had an effect over time. Unlike other channels (for example, Paid Search campaigns), the traffic generated from Organic Search usually has few appreciable oscillations (valleys or peaks). It tends to grow or decline gradually over time and is sometimes influenced by seasonal events. Usually, noticeable fluctuations are associated with updates in the search engine algorithm (Google, Bing, etc.).
The output of the script can be seen in the following images, where important factors such as trend, seasonality, prediction, or data frequency are detailed.
If we analyze the prediction obtained, it could be concluded in a generic way that “if we continue with the same SEO strategy implemented to date, traffic from search engines will continue to grow gradually”. We can ensure that “our efforts for improving the performance of the website, generating quality content, providing relevant links, etc. have been worth it”.
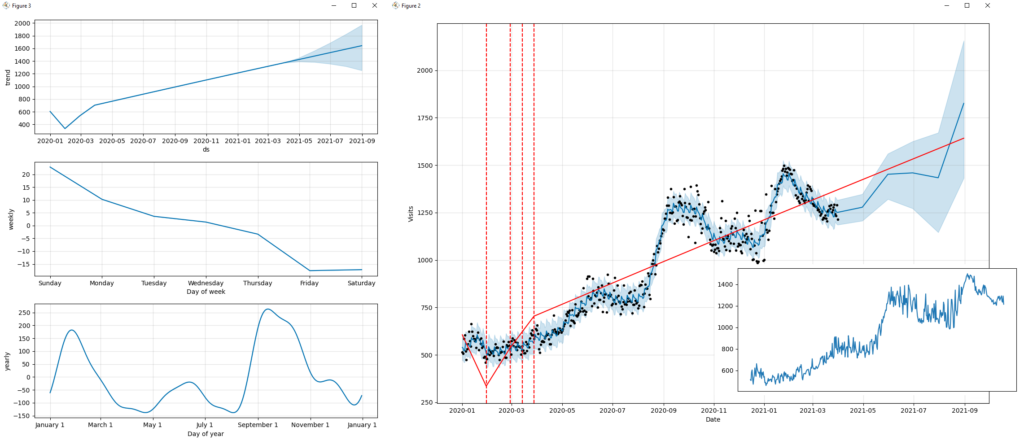
Visualizing trend, seasonality and prediction, trend of the organic search traffic
To conclude, I will be sharing the code in its entirety so that you only have to copy it and run it in your IDE (Integrated Development Environment) of Python. It goes without saying that all the libraries mentioned above must have been installed for this to run properly.
import pandas as pd
import fbprophet
from fbprophet import Prophet
from fbprophet.plot import add_changepoints_to_plot
import matplotlib.pyplot as plt
import os

from google.analytics.data_v1beta import BetaAnalyticsDataClient
from google.analytics.data_v1beta.types import DateRange
from google.analytics.data_v1beta.types import Dimension
from google.analytics.data_v1beta.types import Metric
from google.analytics.data_v1beta.types import Filter
from google.analytics.data_v1beta.types import FilterExpression
from google.analytics.data_v1beta.types import FilterExpressionList
from google.analytics.data_v1beta.types import RunReportRequest

PROPERTY_ID = '[Add here the GA4 property_id]'
START_DATE = '2020-01-01'
END_DATE = '2021-03-31'
PERIODS = 4
FREQ = 'M'

os.environ["GOOGLE_APPLICATION_CREDENTIALS"] = "[Add here the path of the json file with the credentials]"

def ga4(property_id, start_date, end_date):
client = BetaAnalyticsDataClient()

request = RunReportRequest(property='properties/' + property_id,
dimensions=[Dimension(name='date')],
metrics=[Metric(name='eventCount')],
date_ranges=[DateRange(start_date=start_date,
end_date=end_date)],
dimension_filter=FilterExpression(
and_group=FilterExpressionList(expressions=[
FilterExpression(filter=Filter(field_name='sessionDefaultChannelGrouping',
string_filter=Filter.StringFilter(
value='Organic Search',
match_type=Filter.StringFilter.MatchType(
1)))),
FilterExpression(filter=Filter(field_name='eventName',
string_filter=Filter.StringFilter(
value='session_start',
match_type=Filter.StringFilter.MatchType(
1))))
]))
)

response = client.run_report(request)

x, y = ([] for i in range(2))
for row in response.rows:
x.append(row.dimension_values[0].value)
y.append(row.metric_values[0].value)
print(row.dimension_values[0].value, row.metric_values[0].value)

return x, y

def forecasting(x, y, p, f):
print('Prophet %s' % fbprophet.__version__)

data = {'ds': x, 'y': y}
df = pd.DataFrame(data, columns=['ds', 'y'])

m = Prophet(growth='linear',
changepoint_prior_scale=0.5,
seasonality_mode='additive',
daily_seasonality=False,
weekly_seasonality=True,
yearly_seasonality=True,
holidays=None,
)
m.fit(df)
future = m.make_future_dataframe(periods=p, freq=f)
forecast = m.predict(future)

print(forecast[['ds', 'yhat', 'yhat_lower', 'yhat_upper']].head())

fig = m.plot(forecast, xlabel='Date', ylabel='Visits')
add_changepoints_to_plot(fig.gca(), m, forecast)
m.plot_components(forecast)
plt.show()

if __name__ == "__main__":
channel_group, event_count = ga4(PROPERTY_ID, START_DATE, END_DATE)
forecasting(channel_group, event_count, PERIODS, FREQ)
I hope this article has served as inspiration and that it will be of great use to you in your next projects. If you want to continue learning about this type of implementation or learn more about more technical Digital Marketing, please reach out to me. You can find more information in my author profile below.