
The first half of 2020 has been quite eventful for the vast majority of economic sectors. Your activity has most likely been impacted by the situation we are currently experiencing, whether for good or bad.
I work for Liligo, a flight comparison site, and our sector has perhaps been one of the most affected by the COVID crisis. Today, I will explain how to deal with such a situation and how you can track market changes during a crisis in order to quickly adapt to the changes you observe.
During this very particular period we’ve been living through, and specifically during the French lockdown, one of the main metrics we usually focus on had almost become obsolete: website traffic.
As we were dealing with a free-falling market, there was no longer enough traffic to be able to monitor our project.
We needed to put in place a system that would allow us to meet the following objectives:
- Track the growth of our site’s presence in relation to the global demand.
- Segment this tracking reports in order to adjust our marketing activity.
Before going into detail on this subject, you need to know that our process is based on the following article.
Required data
Changes in website presence
In order to estimate the presence of a site on a specific market, there are a lot of tools out there such as SEMRUSH or Sistrix, to cite just a few. However, the most reliable tool remains the Search Console, because the databases of external tools will never be as complete as the actual data for your site. Moreover, external tools tend to under-represent long tail queries.
Keep in mind: Search Console data is not perfect — far from it. Moreover, the sum of your clicks/impressions will not be the same depending on the tab you are using. This difference persists even if you extract the data using the API.
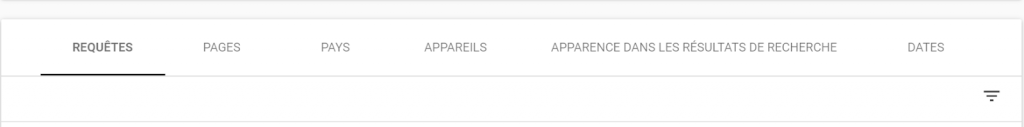
In this case, the data in the query tab represents between 30 and 40% of the total in the “Pages” tab. This situation is far from ideal, but even partial data are more reliable than those of other external tools, according to our experience.
Demand trends
Even though Liligo’s positioning is good for some segments of our business, we cannot use Search Console impressions as a reliable indicator of the market.
Why not? Because we are not on the first page of all our target queries. This wouldn’t give us the state of the market, but the state of the markets for those queries where we rank well — two very different concepts.
To extract the demand trends, we decided to use Google Trends, a very useful tool for detecting trends. The result, a temporal index between 0 and 100, is closely related to the search volumes you can observe.
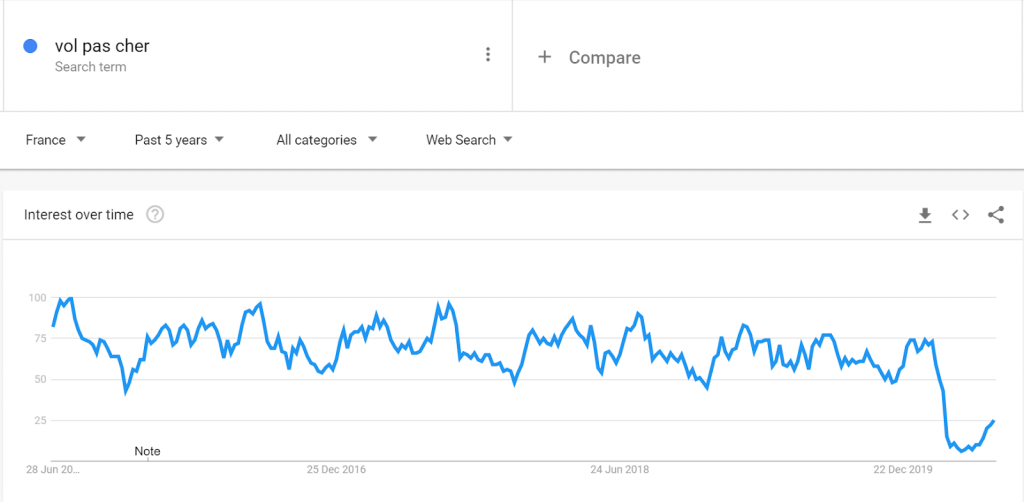
In the next section, we will see how to cross-analyze these two data sources and how to use the results.
Procedure
In order to make our analysis available to all stakeholders, we made the decision to generate it in Google Data Studio. All we had to do was to connect our datasets to this tool to cross-analyze the data.
GSC data extraction
In this step, we had to perform two tasks: extract our daily impressions and classify them by segment.
Why impressions? Because the objective is to make sure that the visibility of the site (its presence for queries) and the changes in demand follow the same trend. The transformation of impressions into clicks depends on many different factors (rank, Google’s SERP features, ads…), so the clicks cannot be used at the risk of rendering the analysis unusable.
Why classify them? The COVID situation has always varied from country to country, so it is important to know which countries and which segments (airplane vs. car rental for example) were the quickest to start up again.
Nothing is easier than getting daily impressions from Search Console in Data Studio: use the native connector.
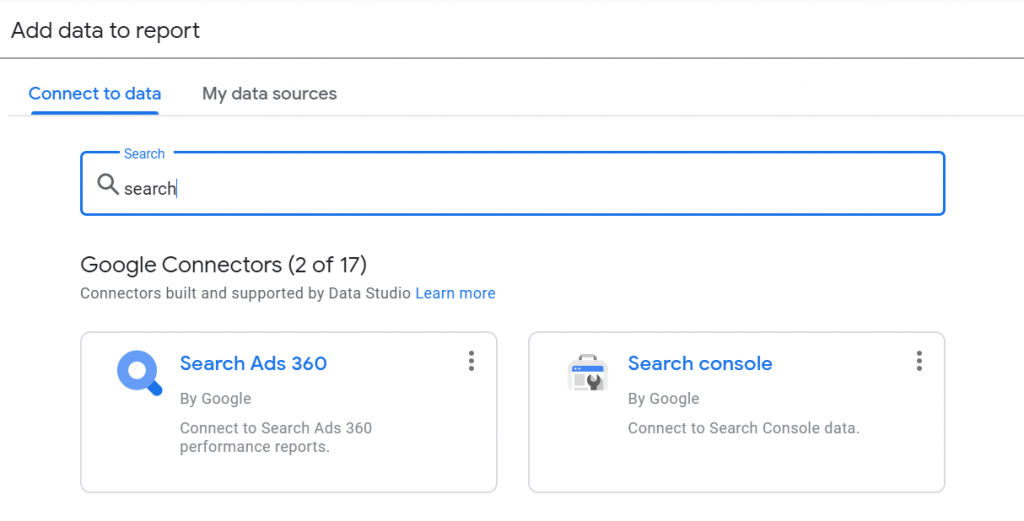
Remember to choose “Site impression” when configuring the connector because we will blend our data with the “query” dimension, which is not available if you choose “URL Impression.”
Choosing your keywords
In order to get an idea of the state of the market, we are going to extract data from Google Trends for some keywords. There are many ways to make this selection, but in our case, we defined a list of top queries for each of our segments.
To get this list, you should take the following points into account::
- Your data per query in Google Search Console
- Your keyword research documents
- The keywords included in reports from external tools such as SEMRUSH or Sistrix
In our case, we identified about 1,000 requests. Be clever in defining these keywords because “flight Morocco”, “flight to Morocco” and “airplane ticket Morocco” will have the same trends: using only main query among these 3 examples will be sufficient. If your selection of keywords is too large, you may have issues at the next step.
Don’t forget to classify your keywords according to the segments you target. We will need them afterwards. In our case, we decided to classify them by creating a different data source for each segment.
[Case Study] Optimize links to improve pages with the greatest ROI

Data extraction via Google Trends API
Once these keywords are defined, you can extract the search volumes from the Google Trends API. For this step, I recommend you read the Search Engine Journal article mentioned at the beginning of this article.
The two magic lines are:

Which will allow you to obtain the data in this form:
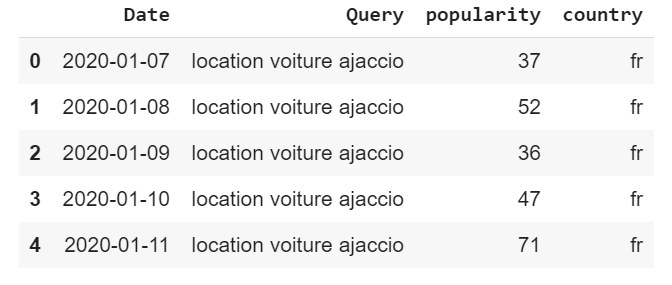
In our case, this data is updated once a week and stored in a BigQuery database. Why? Because data extraction is a bit slow and if you specify a period of more than 3 months, the data is no longer daily but weekly.
It’s up to you to decide whether this structure suits your needs, but if you want to consult the market situation multiple times, automating the extraction process is essential to avoid wasting time.
Once the data has been retrieved, add it as a new data source in Google Data Studio. Whether you decide to store it in a standard Excel or an external database, native connectors are available. Nice!
[Case Study] Optimize links to improve pages with the greatest ROI
Combining data in Data Studio
We now have two different sources of data, and we need to merge them. Our goal is to be able to visualize the data on a single graph so that we can compare trends.
Google Data Studio has a feature that allows you to merge two data sources if they have a column in common. At the end of the day, it’s a bit like a VLOOKUP in Excel. If you need a detailed tutorial on this process, you can read this article.
The setup should look something like the following picture: (example with car rentals):
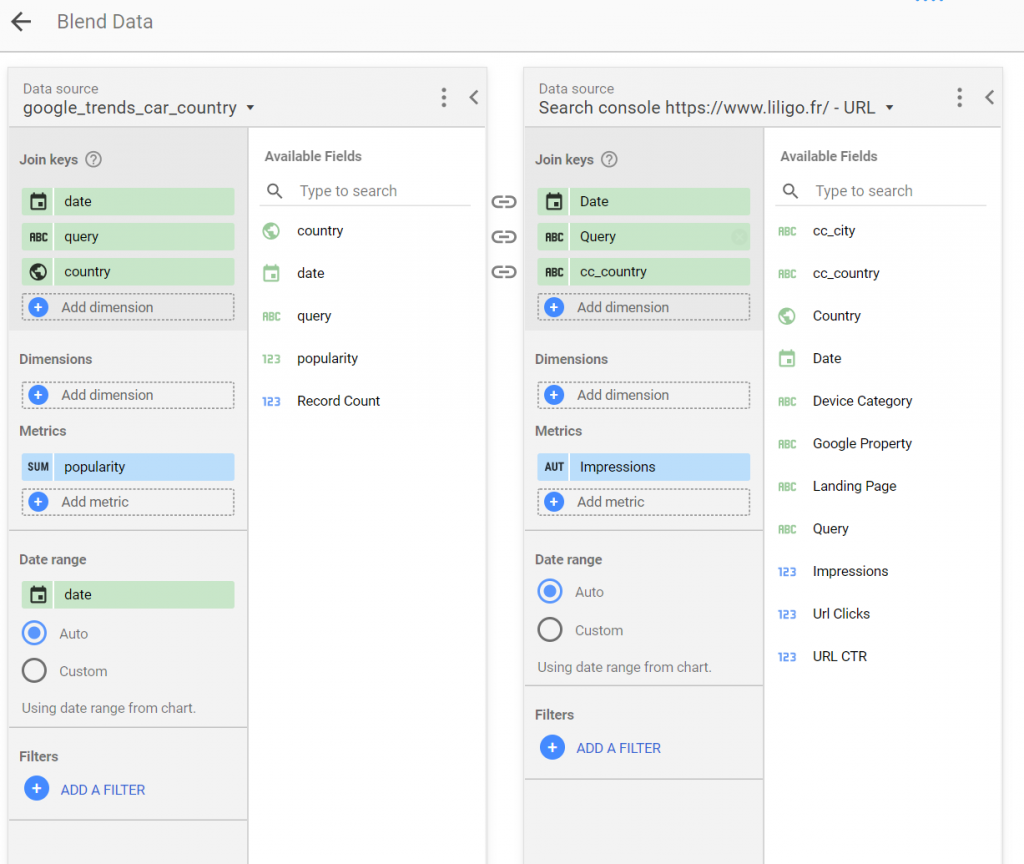
In your case, you may not have the dimensions “country” and “cc_country”, which are the dimensions we use to identify the country associated with a car rental query in a city.
- “Car rental london” ⇒ UK
- “Car rental lisbon” ⇒ USA
Data visualization and data usage
Once our blended source is ready, we can finally visualize all the data. The final rendering looks like this:
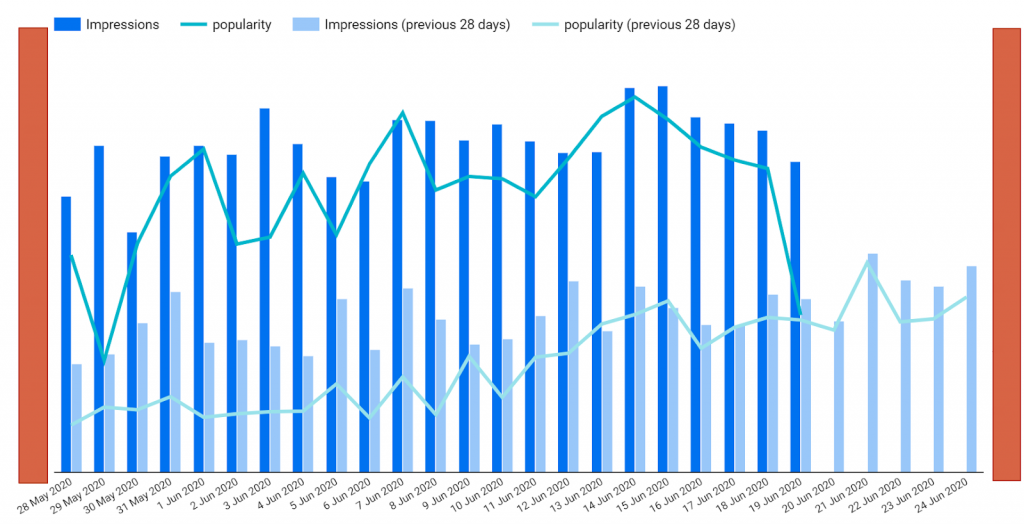
You need to create a graph with two different axes, one for impressions and one for Google Trends data. As you can see, the idea is to make sure that the trend in impressions is consistent with the trend in popularity.
Of course, you may have anomalies for some days but in the end, we can observe that the trend is similar, with a gradual and continuous increase since the government announced the end of the lockdown period.
In our case, we were also monitoring the changes in trends by country of destination and by segment in order to understand in which countries the activity was picking up before the others. This allowed us to focus our efforts (campaigns, content creation) on these countries as a priority.
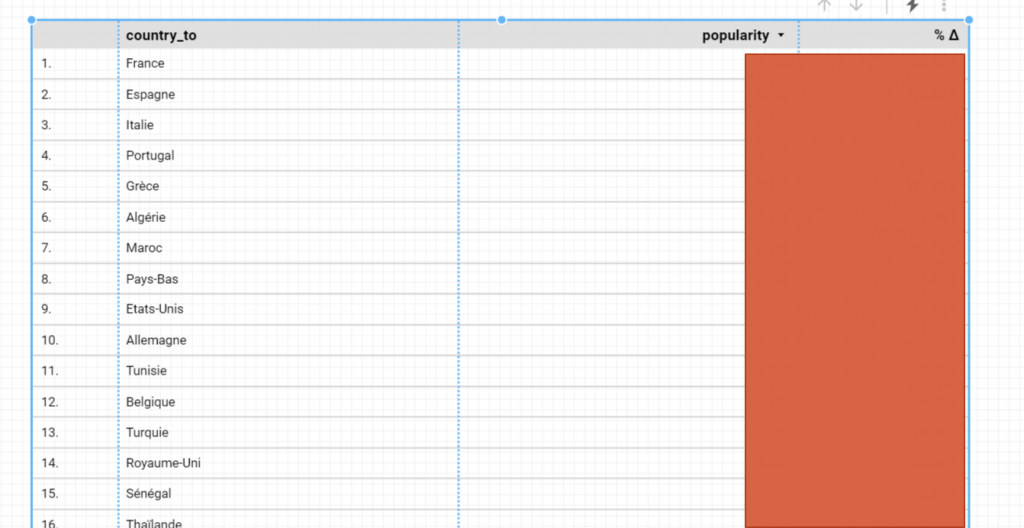
Based on our site’s impressions, we would not have had a global, representative view of the situation.
Conclusion
The procedure we have just outlined is simple to set up but demonstrates the importance of correctly using the data we have at our disposal through transformation and cross-analysis in order to obtain important information about our market.
It is a procedure that:
- is currently invaluable
- costs nothing except a bit of time to get it set up
- runs by itself because it is entirely automated (except for drawing conclusions, obviously)
Although we mainly use SEO tools, this procedure produces a useful report that can be shared with all the contributors in the Marketing / PPC department to relaunch campaigns only in countries that are recovering, and in the Branding department to help them address only these countries with new campaigns.