
For any webmaster, witnessing either a sudden or gradual decline in organic traffic isn’t a great experience.
This is where DevTools can come in handy and complement your suite of third-party tools.
To open DevTools, you can right-click on a webpage and click on “inspect”, or by clicking on the three-dot burger menu in the top right-hand corner of the browser, and selecting More Tools > Developer Tools.
We’ll look at three ways to use DevTools for diagnosing traffic drops.
Location Spoofing for Local SERP Checks
Being able to emulate search results from various locations, especially if your client has physical bricks-and-mortar stores, and specifically being able to emulate local search results from various locations can prove invaluable.
Location spoofing can also prove useful for eCommerce businesses, as product-related “buy intent” search queries can have multiple common interpretations, and sometimes a product can be available locally. By location spoofing in different towns and cities, you can get an idea for how local Google is treating the query, and if you’re potentially losing out on traffic to SERP elements like the Map Pack.

DevTools comes with a predefined list of locations, but you can also add custom locations via GPS coordinates.
You can find GPS coordinates from third-party websites, such as LatLong, or through Google Maps.
Identify Render Blocking Issues
Whilst this issue isn’t commonplace, it has reared its ugly head on a couple of traffic drop audits I’ve done in the past 18 months. Once resolved, it has correlated with improved performance.
From the Network tab in DevTools, you can easily identify which JavaScript and CSS resources are “render-blocking”, e.g. being loaded before the DOM (Document Object Model).
You can also identify non-critical CSS and JavaScript through the Coverage tab (found in Sources):
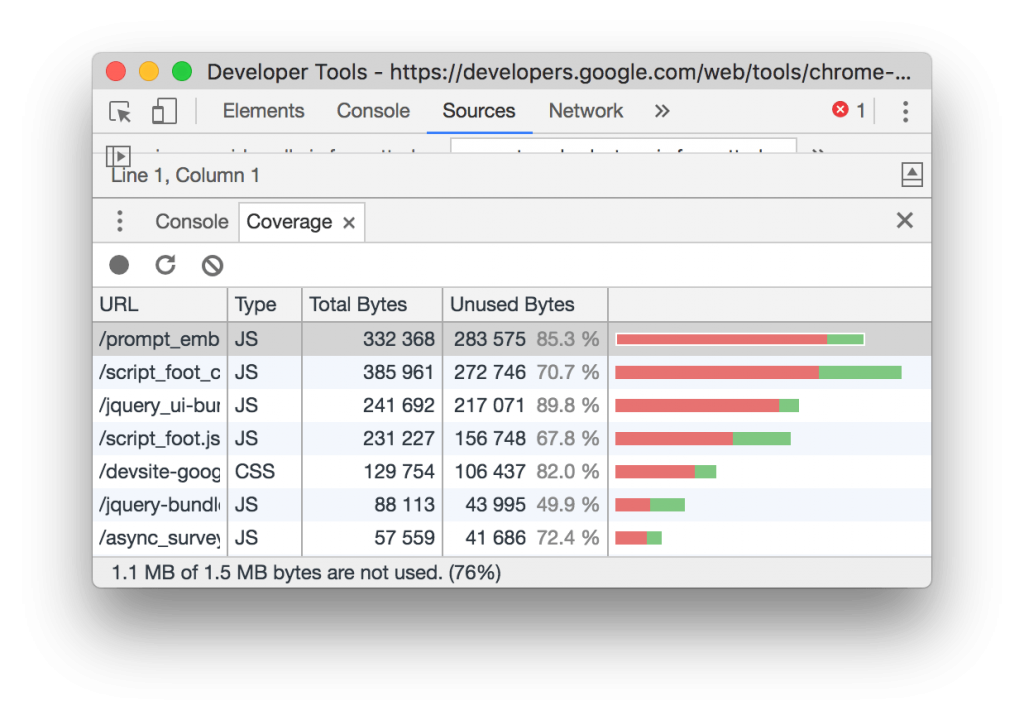
Google Lighthouse identifies three types of blocking resources:
A <script> tag that:
- Is in the <head> of the document.
- Does not have a defer attribute.
- Does not have an async attribute.
A <link rel=”stylesheet”> tag that:
- Does not have a disabled attribute. When this attribute is present, some browsers do not download the stylesheet. Note that this attribute is not supported in all browsers.
- Does not have a media attribute that matches the user’s device.
A <link rel=”import”> tag that:
- Does not have an async attribute.
Viewing Differences Between the DOM & Source Code
Via DevTools you can check webpages (and parts thereof) for differences between the DOM and the source code, which can be very useful for checking if the webpage (or part of it) has been pre-rendered successfully.
View Source shows you the HTML that makes up a webpage and is the HTML that has been delivered from the origin server to the browser. But this isn’t always the case.
The HTML served by your origin server can be manipulated by JavaScript, by the CDN or middleware (e.g. edge SEO), and even by the browser. Through the DevTools you can view the DOM after:
- HTML error correction from the browser
- HTML normalization from the browser
- JS DOM manipulation
A good example of this is the browser correcting an invalid HTML syntax. For example, the below code snippet you would see through view-source:
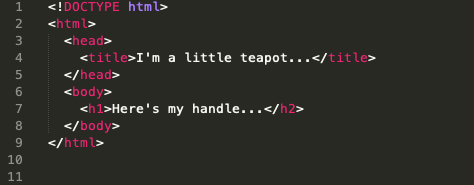
But via DevTools, you’ll find that the syntax error on line 7 has actually been corrected by the browser:
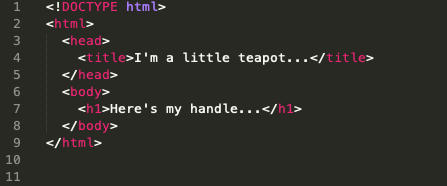
Depending on the auditing tool you use, if any, this may not get picked up if the tool renders the page and DOM via a headless browser, and this issue is self-corrected.
[Case Study] Optimize organic search traffic using log files analysis

Advantages to using DevTools to identify technical issues
Assessing a traffic drop is never an easy task as there is very rarely a single needle within the haystack and an exact solution. But as we’re experiencing what feels like a more regular change schedule from Google, being able to effectively analyze and audit both internal and external factors affecting your website is crucial.
DevTools gives you a free and straightforward way to examine individual web pages within the browser, providing a look at crucial technical elements that can affect SEO performance.