
To understand what affects page speed in 2020, we first need to understand how a browser renders a web page. If you are not familiar with page speed and web technology concepts such as DOM, CSSOM, rendering tree, reflow cost and DOM types, you probably want to start by reading the article linked above.
As websites and web browsers become more complex, page speed becomes about more than just how big a page is or how fast a server can respond. In this article, we’ll look at some of the new and emerging metrics for page speed in 2020 and beyond: number and size of resource requests, critical rendering path, LCP, CLS, and total blocking time.
This article is the second in a series of four articles on page speed. You can find the first article here: How does a browser create a web page?
Managing the order, size and number of resource requests
Each step of the rendering process takes time. The way to find where your website is slow, and how to speed it up, involves looking at how the browser handles the resources during the process of rendenring the page.
This means that the order, the number, and the size of requests plays a major part in measuring page speed today.
The most important contribution of resource order and resource load hints optimization is reducing the TTI (Time to Interactive) through the Largest Contentful Paint. With resource order optimization, you can upload files of the same number and the same size in less time and deliver them to users and search engines.
What is the Critical Rendering Path?
The critical rendering path includes all of the resources that will create the part of the web page above the fold.
Your web page may be slower than your competitors’ web page because of the total load size of your page. But here’s the trick: even if other business departments won’t let you fix the page’s load size, you can still serve your content faster than your competitors by optimizing the critical rendering path.
How to optimize critical rendering path
This is a page speed and conversion rate correlation simulator which is created by Sergey Chernyshev. You may find the answer to the question of what would happen if my web page would load 0.5 seconds faster for the users and show it to your developer team to specify that every millisecond can improve conversion.
To optimize the critical rendering path, you need to determine which resources you need to create your above the fold part. After that, there are a few minor questions to be asked:
- Which resources prevent critical sources from being downloaded by the browser?
- Can the size and number of critical sources be decreased?
- Can critical sources be inlined?
- Can critical rendering path sources be unified to limit the DNS lookup process?
We’ll look at an example. We’ll also provide some recommendations for accelerating CSS, JS and HTML.
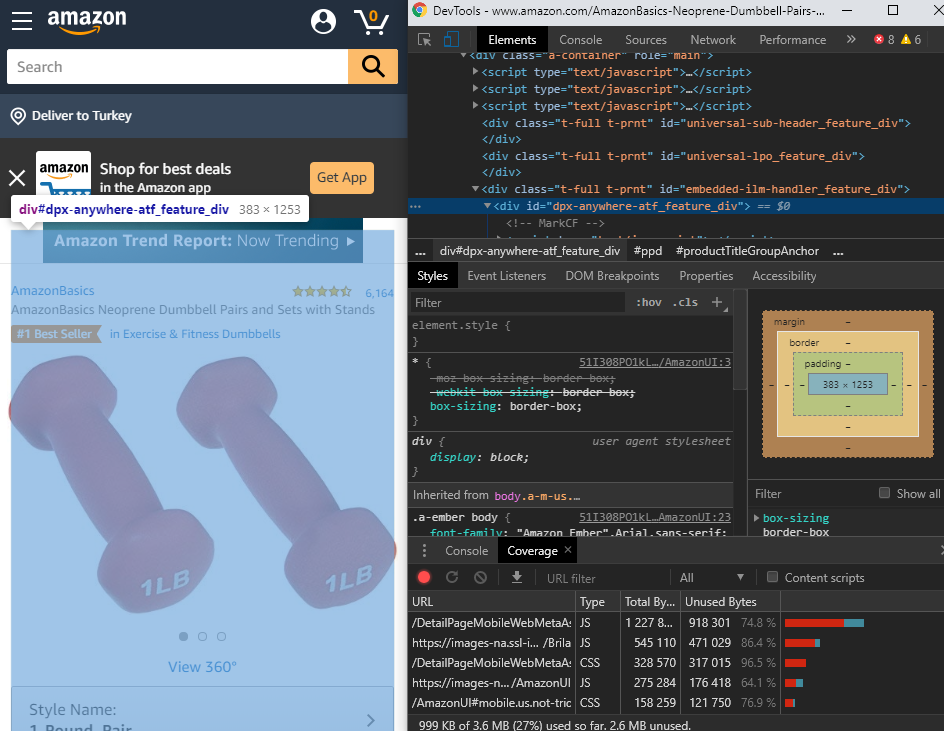
Here is a critical part example from an Amazon web page. With DevTools, you can see the most important <div> element in the critical part of the page along with necessary CSS codes. In this way, you can create an inline CSS code block before render blocking resources disturb the browser. You might also see the unused code stacks at the bottom. Amazon always uses the same CSS/JS resource patterns for different categories,even if they are not optimized.
Beside speed, there is also another problem here. With different sizes of mobile phone screens, the critical part of the web page varies from model to model. Some screens don’t show the price, some of them don’t show the stock information. This is an important design error, but it also makes critical rendering path optimisation harder. It also divides the PageRank value if there is a link in this area and decreases the probability of conversion.
You can use Puppeteer (Googlebot’s Crawl Engine) to examine this type of problem and take automatic screenshots for every smartphone/tablet model and check the design of the critical part of the web page. Jean-Francois Lagarde has a nice Puppeteer library for this task which you may want to check out.
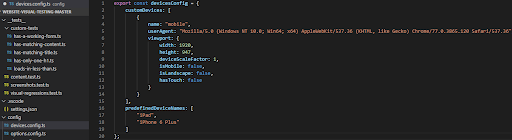
Here is a quick screenshot for device configuration in Puppeteer auto-screenshot for every device viewport tool.
What is the Largest Contentful Paint?
Largest Contentful Paint (LCP) is the biggest area in a web page in terms of bytes and size. In every web page, there are lots of “div” elements and all of them contain different page components. And these components have different page load values.
According to Google, Largest Contentful Paint is mostly affected by the most important element of the page. To give you an idea of the importance of LCP, Google has decided to add this new metric to the Lighthouse reports in the future.
This also means that we’ll hear increasingly more about LCP, as it will be used along with Real User Metrics (RUM) and will be a key metric, particularly where the critical rendering path is concerned.
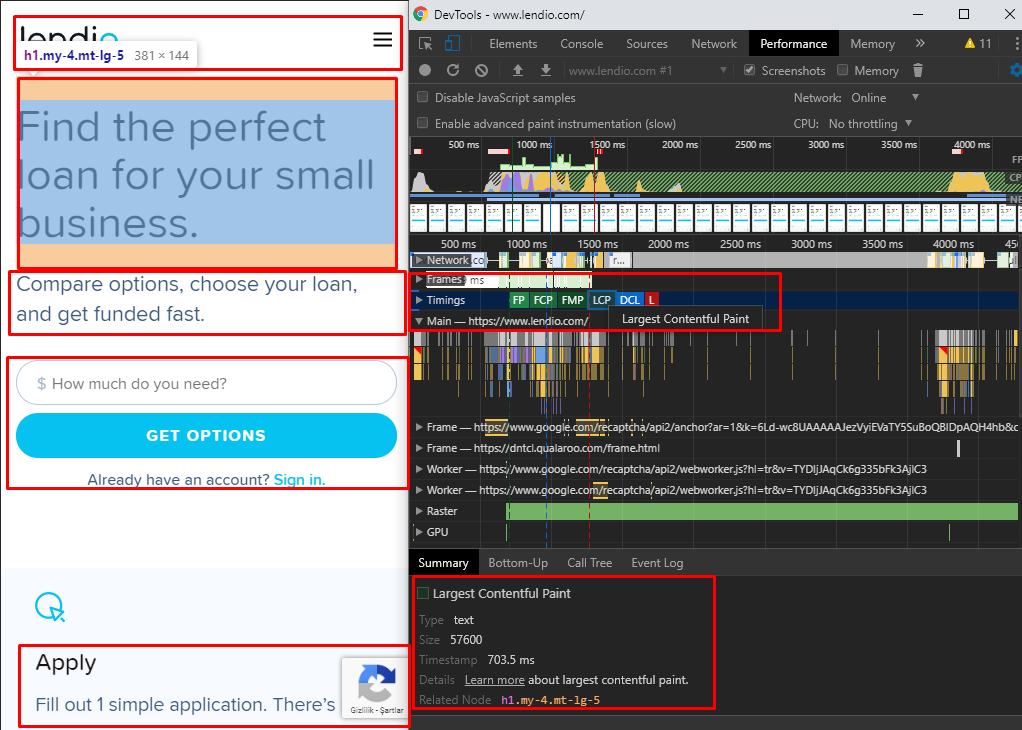
Here is a Largest Contentful Paint example from Lendio. As you can see, DevTools shows the LCP on a page along with data on its type, size and load time. The content of your Largest Contentful Paint should always include the page’s purpose and value, along with the most important functionality or CTA–and, most importantly, it should also be loaded first!
In this example, it is only text. Combining it with a functional tool would be better than just a text/image LCP.
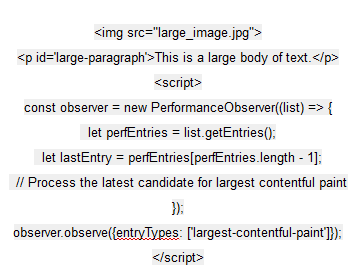
LCP only considers certain types of resources. The main reason for this is to keep LCP measurement simple at first. Below is a “Script Instance” which is stamped to create the LCP entry list. Studying these pieces of code will teach you what and how Google Developers are paying attention to when loading a page.
[Exposed=Window]
interface LargestContentfulPaint : PerformanceEntry {
readonly attribute DOMHighResTimeStamp renderTime;
readonly attribute DOMHighResTimeStamp loadTime;
readonly attribute unsigned long size;
readonly attribute DOMString id;
readonly attribute DOMString url;
readonly attribute Element? element;
[Default] object toJSON();
};
What you see in this list are the scales necessary for comparison of candidate items that enter the LCP entry list. Below, I’ll show you a methodology for choosing the LCP candidates (“large body text” and “large image”).
Understanding the principles and process for defining your LCP
The principles for determining the LCP are extremely important:
- While a page loads, the LCP can change in seconds. Sometimes, even if a page component remains long enough as LCP on the screen, even a larger page element loaded behind does not change the previous state.
- Sometimes, an above-the-fold element (in the critical part of the web page) is selected as the LCP instead of a larger item below the fold (non-critical part of the web page).
- A larger<div> element cannot be selected as LCP if its components are split on the screen. Instead, a block <div> element will be selected as the LCP. Below you will see an example illustrating this.
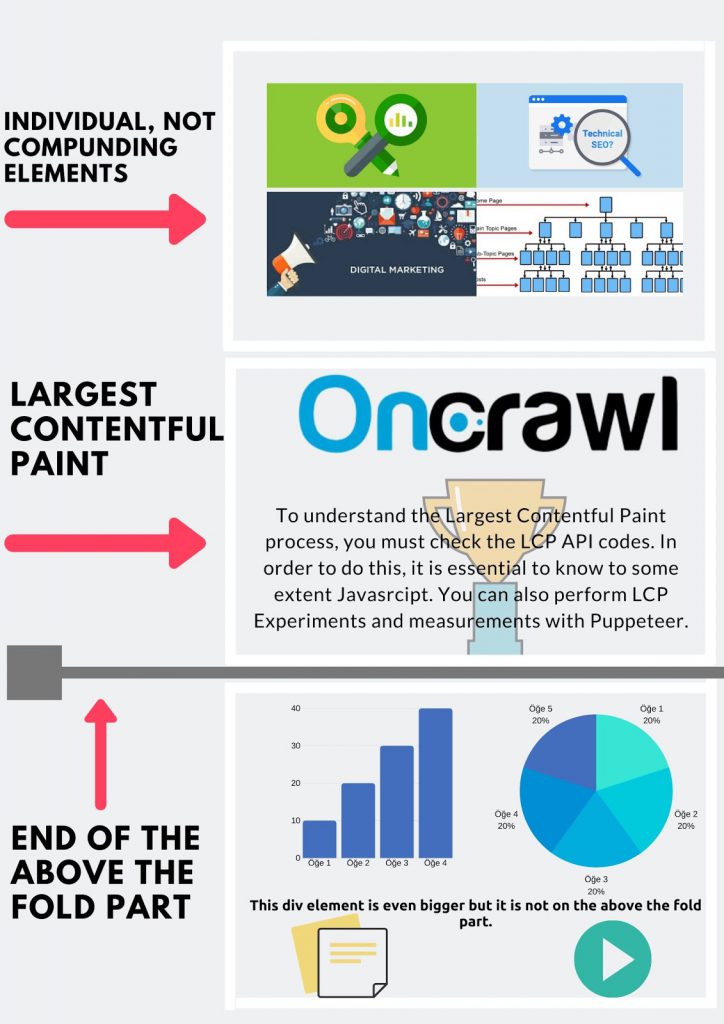
In this example, we see that the largest component is the <div> which includes four different images. But, none of these individual images are larger than Oncrawl Logo and the text which is included with it in the same <div> element. Since both are on the critical part of the web page, the second element will be the LCP.
While calculating LCP timing and and determining the point of view of Google Developers, you should also focus on “compounding” design. If a <div> element doesn’t have compounding and unified design feeling/view, it probably won’t be chosen as LCP.
Even if it is selected, Google Chrome may think that this is not a healthy LCP with new codes that it will add to the LCP API in the future. For reasons pertaining to UX and to a better understanding of page speed, Google will continue to improve its own perception using these methods.
What are Layout Shifting and Cumulative Layout Shifting?
Layout shifting is the idea that, while a page is being downloaded by the browser, page elements change their positions in a way that can be disturbing for the user.
While a page is being downloaded, every page part will be visible one by one in a given order. This is normal. But if these parts change their start position because of subsequent parts, this is layout shifting.
Cumulative Layout Shifting (CLS) is the sum of all layout shifting events.
Chrome User Experience also has a section about the CLS score. But it’s not just about UX. Layout shifting can be harmful for photosensitive epilepsy patients. As a “health company”, Google must also give value to users’ health; they try to decrease “web stress” wherever they can.
“I believe Google is already a health company. It’s been in the company’s DNA from the start”
David Feinberg– Head of Google Health

Here is a simple and decisive layout shifting example from one of the same sites we have seen earlier in this series. It is a main news website from Turkey and this is their main page…
You can read more about Layout Shifting, Flickers, Flashes and Colour Variations which are dangerous for health from Moz Developers.
How to find the cumulative layout shifting on your website
To see shifting layout parts of your web pages you can use Google Chrome DevTools or you can use Layout Instability API to scale the process for all of your web pages.
Cumulative Layout Shifting, or the sum of all layout shifting events, is an important criteria both of page speed and UX in 2020 and beyond. If the above-the-fold part of the web page is shifting while loading, you also need to optimize it when optimizing for speed.
Below, you will find the Layout Shifting Formula, also a Layout Instability API Code example to give you a perspective on the contribution of CLS and a method to calculate your Layout Shifting Score.
Layout Shifting Formula is below:
layout shift score = impact fraction * distance fraction
Layout Shifting score is calculated with two helpful new terms, Impact Fraction and Distance Fraction:
- Impact fraction is the percentage of screen affected by the shift. You know that your CLS will be high if the page element, which covers 50% of viewport on mobile devices, creates layout shift, because moving it will impact, at minimum, more than 50% of the screen.
- Distance fraction is measured by how far the shifting element moves away from its original point in the direction in which it shifts during the shift. If the distance between the first and last position is excessive, the Distance fraction will also be excessive.
This will make it easier for you to estimate your CLS Score and advise your IT and UX teams.
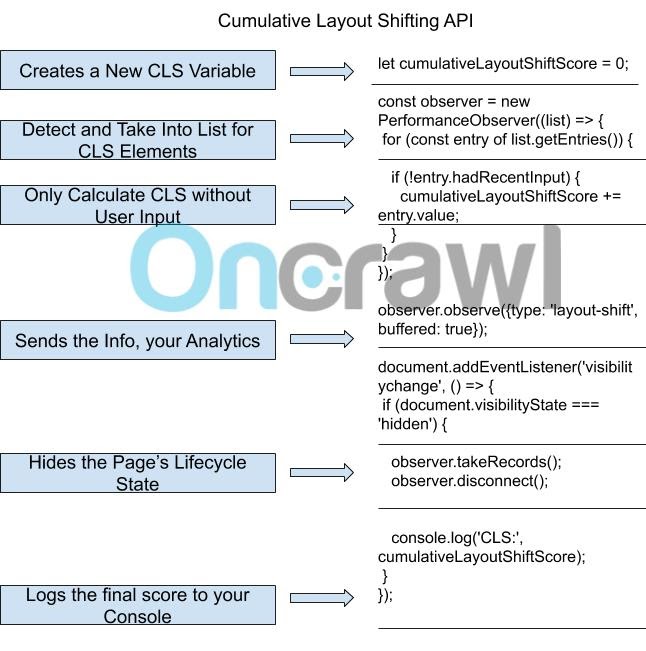
Above, you can see a CLS API Code snippet and below, a GIF which shows how to calculate Cumulative Layout Shifting.
On the same Turkish news site we have been looking at, our CLS is 0,47. Considering it’s calculated between 0 and 1, this is a pretty bad score.
You may calculate your CLS with Webpagetest.org’s Advanced Custom Metric System. You should use CLS API’s codes until “Sends the Info Part.” After that you need to change your URL from root/results/ to root/custom_metrics.php?test={Same Result Number}.
What is Total Blocking Time?
You may download your above the fold part of your web page quickly without any layout shifting but if it is not responding to the user’s input, Google Algorithms claims you have another UX and page speed problem. Total Blocking Time is the time lost at this stage.
Like Cumulative Layout Shifting and Largest Contentful Paint, Total Blocking Time is a new page speed and UX metric for 2020 and beyond.
What counts towards the Total Blocking Time (TBT) is any loading event between the First Paint (FP) and the Time to Interactive (TTI) that blocks the main thread of the browser (or device) for more than 50 milliseconds and prevents users from performing any process.
How to calculate and optimize TBT
You can calculate your Total Blocking Time (TBT) with Long Tasks API.
To optimize your TBT score, you should also focus on the order and preferences for loading resources, along with the number and size of requests.
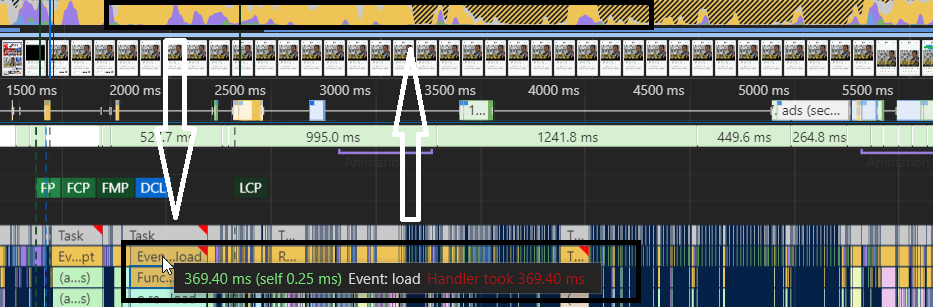
This is from the same site from before. As you may notice, the main thread is completely busy for more than 5 seconds non-stop. Their LCP is still being loaded after nearly 2.5 seconds… The important thing here to note is that their longest task request is longer than 350 MS. This means that it is considered to be blocking the main thread for more than 300 MS.
Also, all blocked times are counted as part of the Total Blocking Time. This not only includes elements in the above-the-fold part but applies to all web page components. It creates a harmful browser history for your web site.
If your TBT is more than 300 Milliseconds, this will probably harm your user retention and conversion rate considerably.
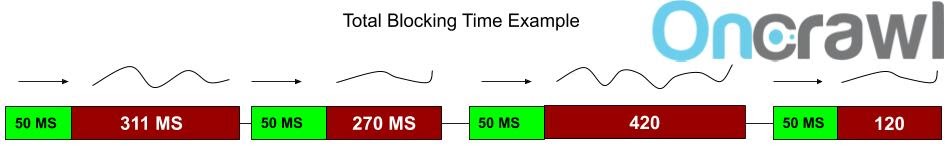
You may see a calculation example for TBT for the main thread above. In this example, there are four requests. Google Chrome can create 6 requests from the same server at one time. Only the first 50 MS of them will go smoothly; after that it will start doing multiple tasks at the same time, as much as CPU/Network power allows. Remember, a human being can see one frame every 16 MS. Google cares about every millisecond for users.
In this example, Total Blocking Time is 1 second and 100 MS.
The next steps in page speed optimization
In this series so far, we’ve now examined how browsers create web pages, which has allowed us to see in this article how new metrics related to how pages load in browsers can affect page speed. We’ve looked at a few of the top new metrics, and how to measure and optimize them.
In the next article in this series about page speed on today’s websites, we’ll cover a topic that has become a major subject in SEO and web development: optimizing JavaScript assets to improve page speed and page rendering.