
Impact of website performance
Page load time has a direct impact on your conversion rate for two main reasons: user experience and SEO.
According to Google, “The average time it takes to fully load a mobile landing page is 22 seconds, according to a new analysis. Yet 53% of mobile site visitors leave a page that takes longer than three seconds to load.”
In other words, if your page load speed is too slow, you can lose over half of your visitors before they even arrive on your site.
We also know that site speed impacts both conversion rate and sales.
A 2019 Portent Study shows that:
- 0-4 second load time is best for conversion rates
- The first 5 seconds of page load time have the highest impact on conversion rates
- Website conversion rates drop by an average of 4.42% with each additional second of load time (between seconds 0-5)
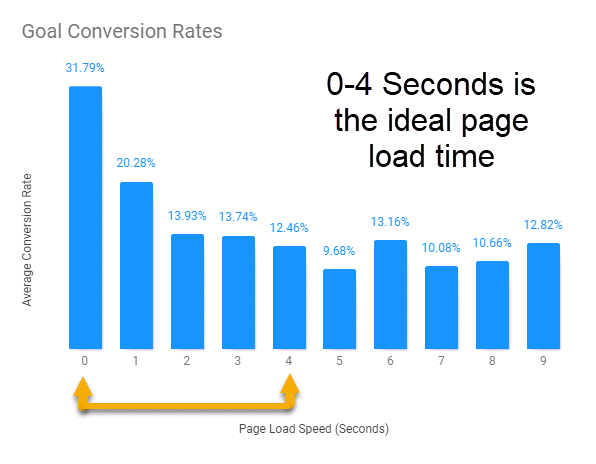
Aiming for a 0-2 second load time, therefore, will help improve your conversions.
Also, don’t forget that a website that is too slow will require more search engine resources to mobilize the robots that crawl your site to index it.
Chances are that these bots will get discouraged and continue their exploration elsewhere if they have trouble accessing your resources, decreasing the indexing capacity of your site and therefore … its visibility!
What are Google Core Web Vitals?
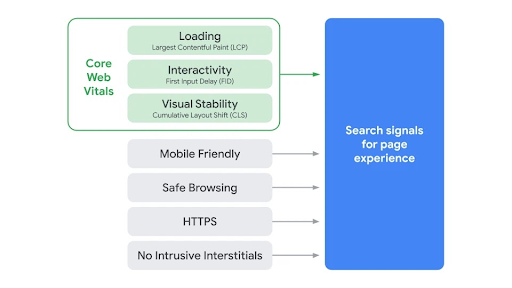
Core Web Vitals are part of factors measuring Google’s “page experience” score (basically the way Google evaluates the overall user experience of a page). They are a combination of three user experience metrics: loading, interactivity, visual stability. They are not all that new; until now, they have been available through other tools such as PageSpeed Insights, but they will be considered as search signals for page experience.
The Core Web Vitals values are taken from the Chrome User Experience Report, which collects real anonymized data from Chrome users around the world.
These data can be considered to have certain limitations: it is only from opt-in users, and is aggregated monthly with a delay of one week or two. However, Google strongly advises website managers to set up their own monitoring.
The next official Google ranking factor
Google plans to make Core Web Vitals an official ranking factor in May 2021.
This update will combine Core Web Vitals and previous UX-related signals.
The page experience will be a mix of factors that Google believes are important to the user experience, including:
- HTTPS
- Mobile friendly
- No intrusive interstitials
- “Safe Browsing” (basically, there is no malware on your page)
We can highlight that an excellent page experience score will not magically rank you to the top spot on Google. This will have an influence on rankings but only to differentiate sites that are very close in content level. Your “Page Experience” score will not allow you to have a better ranking than a page with content more relevant than yours.
This will affect both mobile and desktop results, as well as whether or not your site appears in the Top Stories search feature.
The “Top Stories” block lists the front page articles on Google News. Currently, the contents positioned are URLs in AMP (Accelerated Mobile Pages).
AMP is a page format specially designed to have pages that load quickly on mobile devices.
With the update of the Core Web Vitals in 2021, Google announced that a page with an excellent user experience and a good loading time could now be positioned in the “Top stories” block without necessarily needing an AMP version.
This is a very important step for anyone who wants to get as many SERP features as possible, especially for news websites.
[Case Study] Managing Google’s bot crawling

What metrics do Core Web Vitals include?
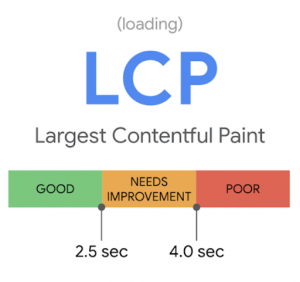
Largest Contentful Paint
“How fast does the page load?”
LCP refers to the render time of the largest video / image / text on the page.It is influenced by your server time, your CSS, JavaScript, client-side rendering. Anything above 4 seconds is considered poor, and will impact your rankings.
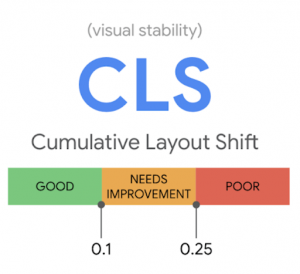
Cumulative Layout Shift
“How fast is it stable?”
Stability of a web page could be influenced by images (size not defined in the HTML), animations… Unexpected layout shifts can be confusing. For example, when you click the wrong thing because the content keeps changing, even though the page looks like it’s fully loaded.
The CLS score should be less than 0.1, as close to 0 as possible.
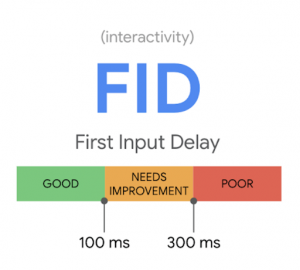
First Input Delay
“How fast is it interactive?”
When a user clicks on a button, how fast can the browser respond? It is influenced by JavaScript or third-party code. If the user clicks on a button and the page responds to this interaction in less than 100ms, the FID is considered good.
How to measure Core Web Vitals
Utilize all Google optimization tools
The best way to ensure you’re meeting Google’s standards for site quality, is to optimize using Web Vitals tools, including: Search Console, PageSpeed Insights, Lighthouse, Chrome DevTools, Chrome UX report and the new Web Vitals Chrome extension.
You can test and benchmark, cross referencing performance scores from each tool. You may need a web developer who is an expert in page speed or someone else who can comfortably address these problems if you’re not very technical.
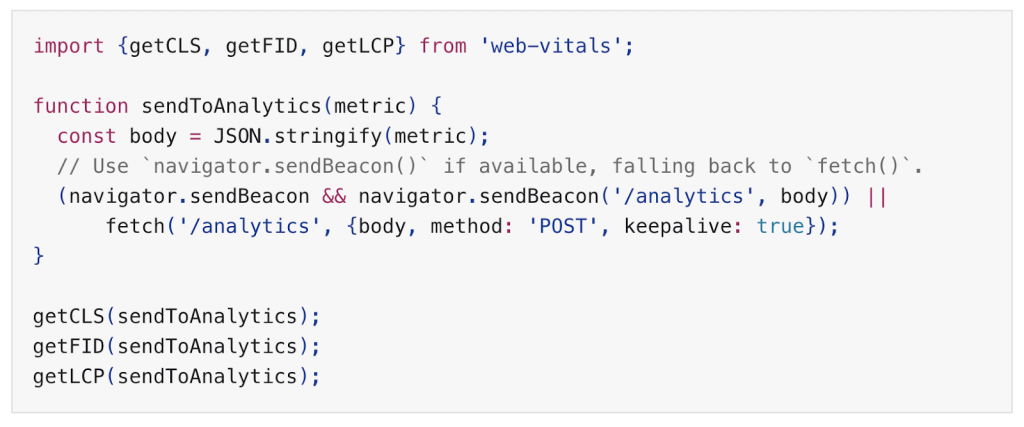
Measure Core Web Vitals in JavaScript
Using this script, you can directly push Core Web Vitals data to Google Analytics!
A small, production-ready wrapper that measures each metric in a way that accurately matches how they’re reported by all the Google tools listed before.
Measuring Core Web Vitals with a crawler
- Get Core Web Vitals data using a Python script on the API
- Add the resulting URLs file to a crawl
- Create a segmentation to get a clearer view of the situation
- Analyze!
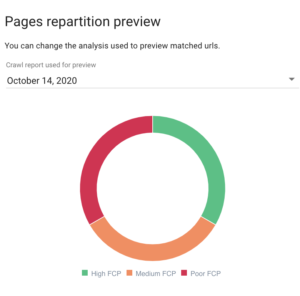
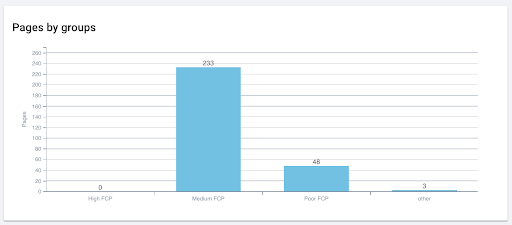 Examining FCP per URL in Oncrawl.
How to fix poor Core Web Vitals scores
Optimize your images
- Optimize your hero image to make it appear within the LCP threshold by compressing it or converting it to a more efficient format.
- Evaluate all your site images. You can pre-set dimensions using size attributes.
- Always include width and height attributes on your image and video elements. It avoids sudden shifts in your layout as the browser knows exactly how much space it needs.
Upgrade your web hosting
- Faster server response time will improve all your metrics across the board.
- It will shorten your JavaScript execution time and minimize delays in user interactions.
Prioritize Above-The-Fold Content
- The content that users immediately see before scrolling down is what catches the most attention
- Optimize and render your above-the-fold content first and defer non-critical JavaScript. You can implement lazy loading, so only the visible content is loading, other images and videos are not loaded until they are actually needed.
Keep creating and optimizing your content
- As Google itself says, great page experience doesn’t override having great page content.
- There will still be room for high quality content, even with lower speed performance.
Monitor Mobile-Responsiveness
- Mobile-first indexing will apply to every single website in March 2021. Google recommends responsive web design for new websites.
- Pages that show intrusive interstitials provide a poorer experience to users than other pages where content is immediately accessible.
In summary
This upcoming change should be monitored carefully, because it incorporates new indicators that are very relevant not only for SEO but also for improving the user experience.
Once it rolls out, it will be necessary to measure the real impact of this update on the rankings.
There are many axes for optimization that have an impact on Core Web Vitals. These are technical problems that can be complex to solve and depend on the site infrastructure and its technologies. Measuring the real impact on rankings will be that much more important, as changes you make may take a long time to show satisfactory results.
This is why Core Web Vitals should be taken into account as a priority from the wireframe stage of your projects. In the short term, the ideal is to have at least estimated times to optimize for each metric and to include these optimizations little by little in your roadmap.