
Setting targets and evaluating accomplishment over time is a very interesting exercise in order to understand what we are able to achieve and if the strategy that we use is effective or not. However, it is not usually so easy to set these targets because we will first need to come up with a forecast.
Creating a forecast is not an effortless thing but thanks to some available forecasting procedures, our CPU and some programming skills we can reduce its complexity quite a lot. In this post, I am going to show you how we can make accurate predictions and how you can apply this to SEO by using Python and the library Prophet and without having to have fortune-teller superpowers.
If you have never heard about Prophet you might wonder what it is. In short, Prophet is a procedure for forecasting which was released by Facebook’s Core Data Science team which is available in Python and R and which deals with outliers and seasonal effects very well to
deliver accurate and fast predictions.
When we speak about forecasting, we need to take into consideration two things:
- The more historical data we have, the more accurate our model and therefore our predictions will be.
- The predictive model will only be valid if the internal factors remain the same and there are no external factors affecting it. This means that if for instance, we have been publishing one post per week and we start publishing two posts per week, this model might not be valid to predict what the outcome from this strategy change will be. On the other hand, if there is an algorithm update, the model might not be valid either. Keep in mind that the model is built based on historical data.
To apply this to SEO what we are going to do is to predict SEO sessions for the upcoming month following the next steps:
- Getting data from Google Analytics about the organic sessions for a specific period of time.
- Training our model.
- Forecasting the SEO traffic for the upcoming month.
- Evaluating how good our model is with the mean absolute error.
Do you want to get to know more about how this forecasting procedure works? Let’s get it started then!
Getting the data from Google Analytics
We can approach the data extraction from Google Analytics in two ways: exporting an Excel file from the normal interface or using the API to retrieve this data.
Importing the data from an Excel file
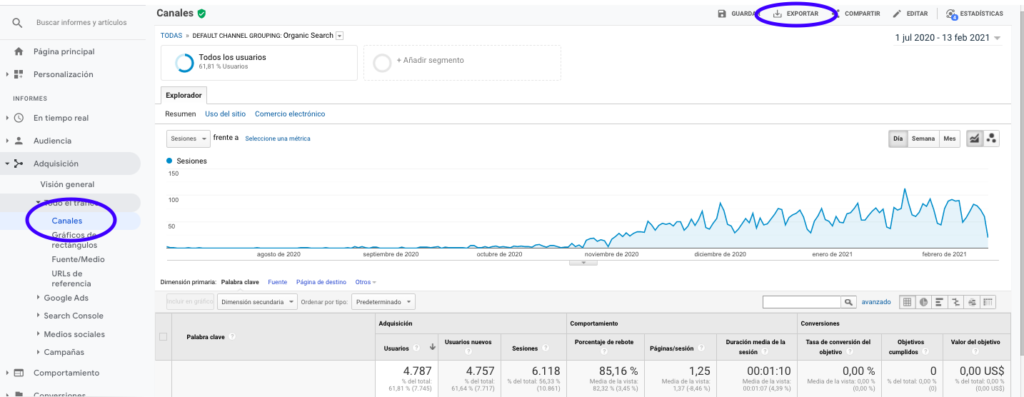
The easiest way to get this data from Google Analytics is going to the Channels section on the side bar, clicking on Organic and exporting the data with the button which is on top of the page. Make sure that you select on the dropdown menu on top of the graph the variable that you would like to analyse, in this case Sessions.
After exporting the data as an Excel file, we can import it into our notebook with Pandas. Note that the Excel file with such data will contain different tabs, so the tab with the monthly traffic needs to be specified as an argument in the piece of code which is below. We also erase the last row because it contains the total amount of sessions, which would distort our model.
import pandas as pd

df = pd.read_excel ('.xlsx', sheet_name= "")
df = df.drop(len(df) - 1)

We can draw with Matplotlib how the data looks like:

from matplotlib import pyplot

df["Sesiones"].plot(title = "Sesiones")
pyplot.show()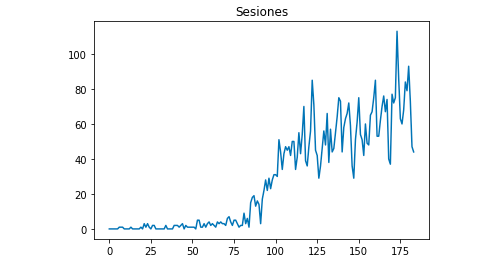
Using Google Analytics API
First of all, in order to make use of Google Analytics API, we need to create a project on Google’s developer console, enable the Google Analytics Reporting service and get the credentials. Jean-Christophe Chouinard explains very well in this article how to set this up.
Once the credentials are gotten, then we need to authenticate before making our request. The authentication needs to be done with the credentials file which was obtained initially from Google’s developer console. We will also need to write down in our code the GA View ID from the property that we would like to use.
from apiclient.discovery import build
from oauth2client.service_account import ServiceAccountCredentials

SCOPES = ['https://www.googleapis.com/auth/analytics.readonly']
KEY_FILE_LOCATION = ''
VIEW_ID = ''

credentials = ServiceAccountCredentials.from_json_keyfile_name(KEY_FILE_LOCATION, SCOPES)
analytics = build('analyticsreporting', 'v4', credentials=credentials)
After authenticating, we just need to make the request. The one that we need to use to get the data about the organic sessions for each day is:
response = analytics.reports().batchGet(body={
  'reportRequests': [{
  'viewId': VIEW_ID,
  'dateRanges': [{'startDate': '2020-09-01', 'endDate': '2021-01-31'}],
  'metrics': [
    {"expression": "ga:sessions"}
  ], "dimensions": [
    {"name": "ga:date"}
  ],
"filtersExpression":"ga:channelGrouping=~Organic",
"includeEmptyRows": "true"
}]}).execute()
Note that we select the range of time in the dateRanges. In my case I am going to retrieve data from the 1st of September until the 31st of January: [{‘startDate’: ‘2020-09-01’, ‘endDate’: ‘2021-01-31’}]
After this we only need to fetch the response file to append to a list the days with their organic sessions:
list_values = []
for x in response["reports"][0]["data"]["rows"]:
list_values.append([x["dimensions"][0],x["metrics"][0]["values"][0]])
As you can see, using Google Analytics API is quite simple and it can be used for many objectives. In this article, I explained how you can use Google Analytics API to create alerts to detect underperforming pages.
Adapting the lists to Dataframes
To make use of Prophet we need to input a Dataframe with two columns that need to be named: “ds” and “y”. If you have imported the data from an Excel file, we already have it as a Dataframe so you will only need to name the colums “ds” and “y”:
df.columns = ['ds', 'y']
In case you made use of the API to retrieve the data, then we need to transform the list into a dataframe and name the columns as required:
from pandas import DataFrame
df_sessions = DataFrame(list_values,columns=['ds','y'])
Training the model
Once we have the Dataframe with the required format, we can determine and train our model very easily with:
import fbprophet
from fbprophet import Prophet

model = Prophet()
model.fit(df_sessions)
Making our predictions
Finally after training our model we can start to forecast! In order to proceed with the predictions we will first need to create a list with the range of time that we would like to predict and adjusting the datetime format:
from pandas import to_datetime

forecast_days = []
for x in range(1, 28):
date = "2021-02-" + str(x)
forecast_days.append([date])
forecast_days = DataFrame(forecast_days)
forecast_days.columns = ['ds']
forecast_days['ds']= to_datetime(forecast_days['ds'])
In this example I use a loop which will create a dataframe that will contain all the days from February. And now it is just a matter of using the model that was trained previously:
forecast = model.predict(forecast_days)
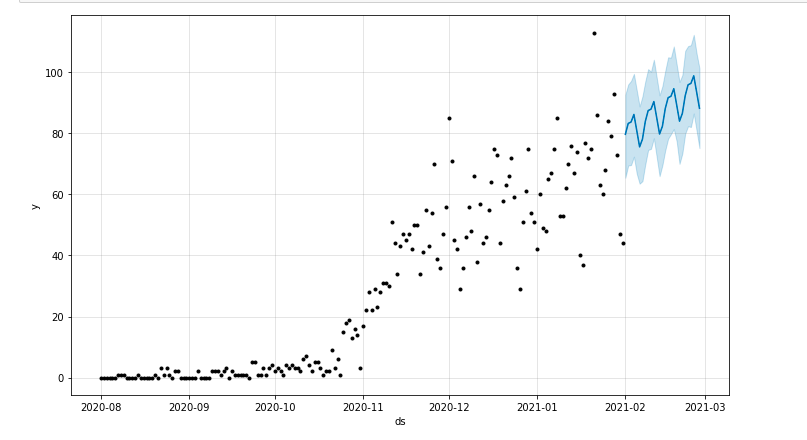
We can draw a plot highlighting the forecasted period of time:
from matplotlib import pyplot
model.plot(forecast)
pyplot.show()
Evaluating the model
Finally, we can evaluate how accurate our model is by eliminating some days from the data which is used to train the model, forecasting the sessions for those days and calculating the mean absolute error.
As an example, what I am going to do is to eliminate from the original dataframe the last 12 days from January, forecasting the sessions for each day and comparing the actual traffic with the forecasted one.
First we eliminate from the original dataframe the 12 last days with pop and we create a new dataframe that will only include those 12 days which will be used for the forecast:
train = df_sessions.drop(df_sessions.index[-12:])
future = df_sessions.loc[df_sessions["ds"]> train.iloc[len(train)-1]["ds"]]["ds"]
Now we train the model, make the forecast and we calculate the mean absolute error. In the end, we can draw a plot which will show the difference between the actual forecasted values and the real ones. This is something that I learnt from this article written by Jason Brownlee.
from sklearn.metrics import mean_absolute_error
import numpy as np
from numpy import array

#We train the model
model = Prophet()
model.fit(train)

#Adapt the dataframe that is used for the forecast days to Prophet’s required format.
future = list(future)
future = DataFrame(future)
future = future.rename(columns={0: 'ds'})

# We make the forecast
forecast = model.predict(future)

# We calculate the MAE between the actual values and the predicted values
y_true = df_sessions['y'][-12:].values
y_pred = forecast['yhat'].values
mae = mean_absolute_error(y_true, y_pred)

# We plot the final output for a visual understanding
y_true = np.stack(y_true).astype(float)
pyplot.plot(y_true, label='Actual')
pyplot.plot(y_pred, label='Predicted')
pyplot.legend()
pyplot.show()
print(mae)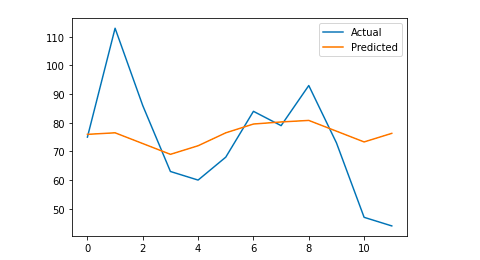
My mean absolute error is 13, which means that my forecasted model assigns to each day 13 more sessions than the real ones, which seems to be an acceptable error.
That’s all folks! I hope that you found this article interesting and you can start making your SEO predictions in order to set targets.