
The example below is from a large, complex news website. They have been losing organic traffic for years. Their DOMContentLoaded Event timing is 2615.2 MS. You may think that their DOM size is extremely huge, but no…
It is almost the same as what Google recommends, and only 1230 HTML nodes exist in this document.
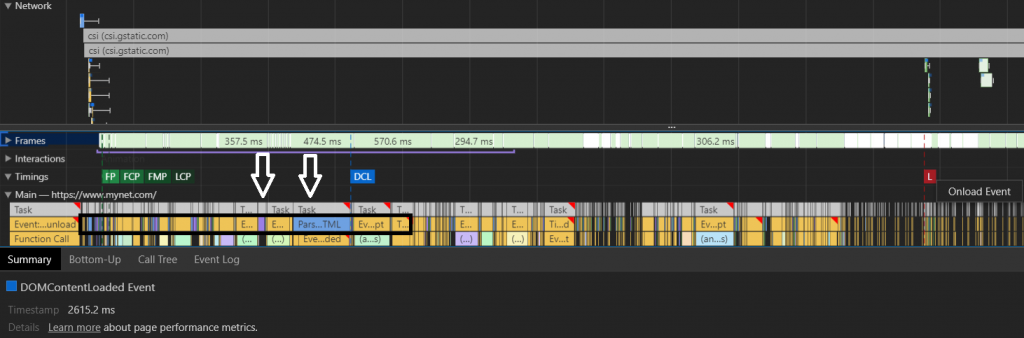
You can calculate your domContentLoaded Event timing and process and compare it to your competitors using DevTools.
Examining this example shows that the DOM size is not necessarily the critical point. Here, the main problem is Resource Order: the blue parts in “Main Tab” are for HTML parsing. However, this website interrupts the browser with JavaScript rendering before the HTML parsing process is finished.
(You can use the Call Tree section as well to help find similar mistakes for your IT team.)
This example clearly illustrates the importance of optimizing JavaScript assets, and what can go wrong when you neglect JavaScript in your page speed optimizations.
This is the third in a series of four articles. To better understand this article, you may want to read the first two articles of the series:
- Javascript rendering and page speed are closely related to how a browser’s rendering engine creates a web page.
- You should also understand advanced page speed metrics before getting into this article.
I will use a few examples from the first two articles to help provide context in this one.
What is Javascript Rendering and how it is affecting your page speed?
Javascript rendering is the last page loading section that can interactively change the structure created using the DOM and CSSOM. Any page element can be changed in a user-triggable format or displayed as normal. Any element with a display:none property that could not be accessed by the rendering tree can be rendered visible with JavaScript or injected via different HTML elements into the DOM.
JavaScript interrupts the DOM and CSSOM because it changes the DOM and CSSOM at the time they are read by the browser. Therefore, to keep it from negatively impacting page load time and speed, it is necessary to examine the relationship between the DOM, CSSOM and JavaScript rendering.
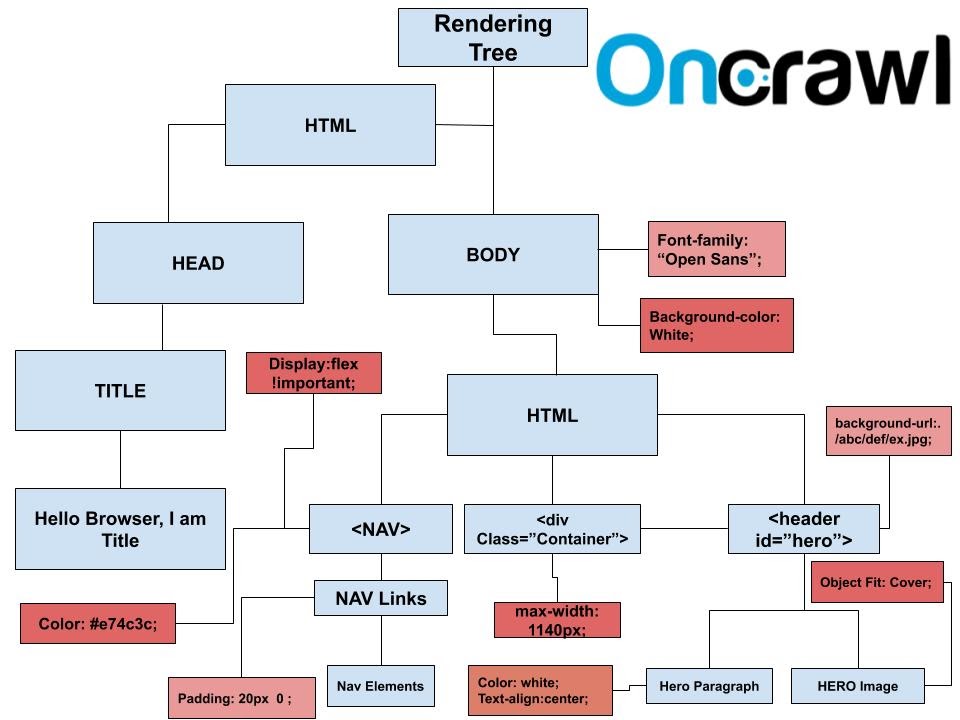
Above is an example of a rendering tree. All interlocking snippets of code in CSSOM and HTML nodes have semantic equivalents in the rendering tree. If you look carefully, you will notice that the “Action Button” HTML node is not in the rendering tree. The main reason for this is “display:none;” CSS property. Because of this invisibility command, it is not included in the rendering tree. To see how the elements in this tree were built, you might want to read the first article in this series.
If you have many page elements that will not appear on the first load because they depend on user behavior, in the resource load order, you will have to separate these items and put them in the last row. Using a shadow DOM or a virtual DOM are better options at this point.
Defer and Async Attributes for JavaScript Resources
If you put your JS files into thesection and if you don’t use ‘defer’ or ‘async’ attributes it will probably delay your DOMContentLoaded time. To prevent this situation, we may use these two attributes. Defer is to delay the loading process of a JS file while ‘Async’ is to load JS and other sources in a parallel way. Both have advantages and disadvantages. We will only talk about the main ones here.
- If you use defer on a main JS file, you will probably not see its ‘initiator’ effects until it is being installed.
- If you use defer too much, you may cause a CPU Bottleneck at the end of page load.
Since this article was written, the Chrome 80 update was released. In the Initiator column, it is now much easier to see which resource is called by which resource. For example, you can see an image or CSS file called by JS. If you scroll through the resources by holding down the shift key, you will also see which resource cannot be used without loading other resources.

Scrolling while holding the shift key: the red color indicates the conditional resource for the resource highlighted in green.
You can also use the new Initiator section from Chrome for a more detailed resource load order, initiator, and priority review. This allows you to detect extremely long and costly JS call chains such as the one below.

An example of a long and costly JS call chain from the same site. Above the selected resource are its initiators. The next part shows the resources initiated by the selected resource.
- Deferred JS files are downloaded after the domInteractive event, so you need to choose them according to your CSS files and images.
- If you defer some user-tracker 3rd party JS files, you may not be able to track certain user behaviors.
- Defer usually doesn’t block the DOM process but Async does. JS files with async attributes are downloaded by the browser during HTML parsing and CSSOM processing.
- If you use the async attribute too much, probably you will create a CPU processing bottleneck and also you will slow down your DOM and CSSOM processes. You need to choose carefully what to defer or async.
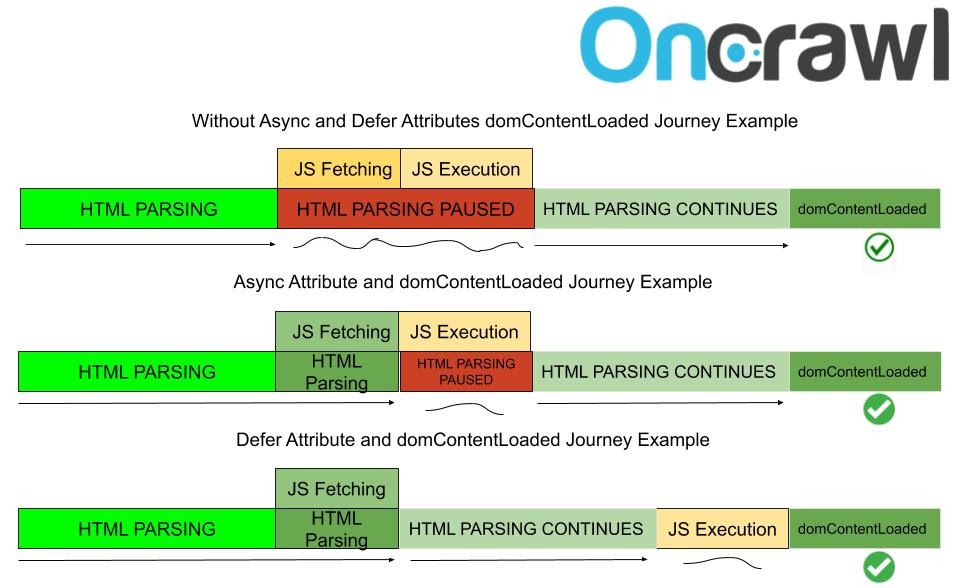
Here is an example scheme for async and defer attributes. The first one is loaded before domContentLoaded without splitting HTML parsing during fetching. In the second, the fetched JS file is not executed before HTML parsing is finished.
Suggestions and tips for Javascript rendering and performance
Before getting into practice examples, here are a few suggestions to improve JavaScript rendering performance. This might also help provide a better understanding of page speed and how a browser works.
Don’t use unnecessary variables.
If you are SEO, you may notice unnecessary or unused variables in a JavaScript file. There are many tools that can be used to detect this kind of error. You will find two basic examples for unused and unnecessary variables below.
var carName= brand+ ” ” + year;
document.getElementById(“demo”).innerHTML = carName;
Here, the variable “carName” is unnecessary. You can suggest the following modification:
document.getElementById(“demo”).innerHTML = brand+ ” ” + year
Or:
[a, b, c, d, e].forEach(function (value, index) {
console.log(index);
});
Here, the “value” parameter is not necessary, because it is not used. You can remove it:
[a, b, c, d, e].forEach(function (index) {
console.log(index);
});

On the right side, you can see longer connection times (white lines) and CSS and JS files are loaded in asymmetric order thanks to “async” Javascripts.
On the left side, connection times are shorter and CSS and JS files are not mixed because each source is loaded in rows. Async attributes can reduce your Speed Index as it can extend the TBT time, so you need to perform an investigation and report it to your developer team for performance tracker JS files from the performance tab, or you can run some experiments by yourself.
Use tools for difficult tasks
For a beginner in code, finding unnecessary or unused variables can be hard. You may want to use some tools for these tasks, such as Chrome DevTools or Node.js packages like Unused (Kami/node-unused: A module which reports defined, but unused variables in your code. or for more unused variables). If you find even some small errors, I believe that your IT team will listen to you for making your JavaScript files better.
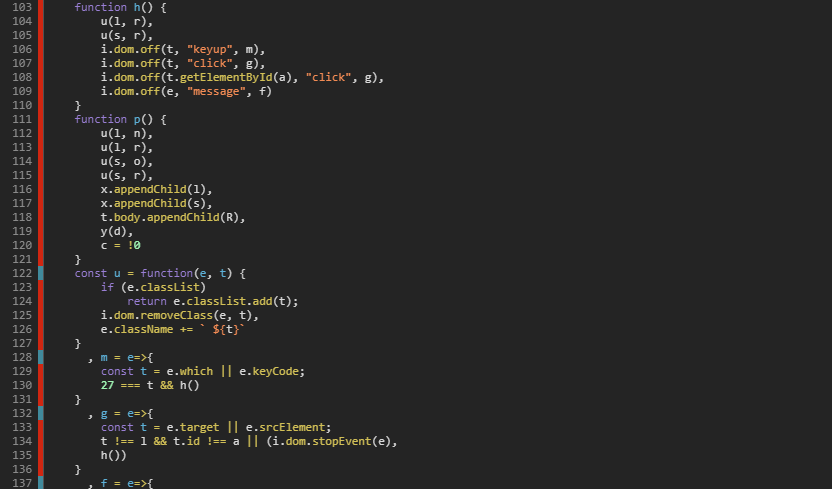
Using the Chrome DevTools Coverage Report to find unused JavaScript code
Chrome DevTools Coverage Report shows unused JavaScript code snippets but it is not very practical. You may think that you can delete every red part from the code but it is not the case… Instead, you should find completely unused functions or variables for large numbers of category pages. This way, your developer team can be convinced to use a TreeShaking process.
TreeShaking means deleting dead code from files. I recommend learning using unused JS variables and functions finder packages in order to gain time.
A smaller DOM size also will help with JavaScript rendering. Every (getElementsByTagName) command will scan your DOM. A smaller DOM size will require less resources from your browser and your device’s CPU/network when rendering JavaScript.

With the new Chrome 80 update, the coverage report also underwent a change. They have added optional Per Function and Per Block choices. Per Block is the default value here.
If you choose Per Function, you will see a big difference in your report. The main reason for this situation is that the Per Function view checks whether all of the function is being used or not. If 95% of the function is being used, the Per Function option will define it as unused code because 5% of the code is not used, although the bulk of the function is used.
Compress, Minify or Uglify your JS files.
This can be done in two ways. First, delete the spaces and unnecessary comments. Second, use improved JavaScript operators for your JS files and mangle names, variables, functions with ready-to-go technologies.
You should know about Arrow Functions for this kind of compression. For instance, instead of this 84-character example:
function arrow İşlev (a, b) {
console.log (a + b);
}
arrowFonksiyon (5, 6);
You may compress it to only 50 characters with arrow functions =>
const ab = (a, b) => b + a;
console.log (ab (5, 6));
Another shorten/compress method is valid for If statements. Instead of this code snippet with 63 characters:
if (a<b) {
console.log(a-b);
}
else {
console.log(a+b);
You can use the one with 43 characters below:
(a<b) ? console.log(a-b) : console.log(a+b);
You can also suggest to your IT team that they use $ and _ signs for compression. Most of the JavaScript files work for reinterpreting DOM. To this, you may see lots of document.getElementById(x); code snippets in files. You may use a $ sign for this task. This will save you from a huge pile of useless size.
Most JavaScript libraries use $ by default for function definition, but not all, because $ is also an alphabet character.
In this situation you may suggest that your IT team use:
function $(x) {return document.getElementById(x);} .
Use an appropriate rendering type
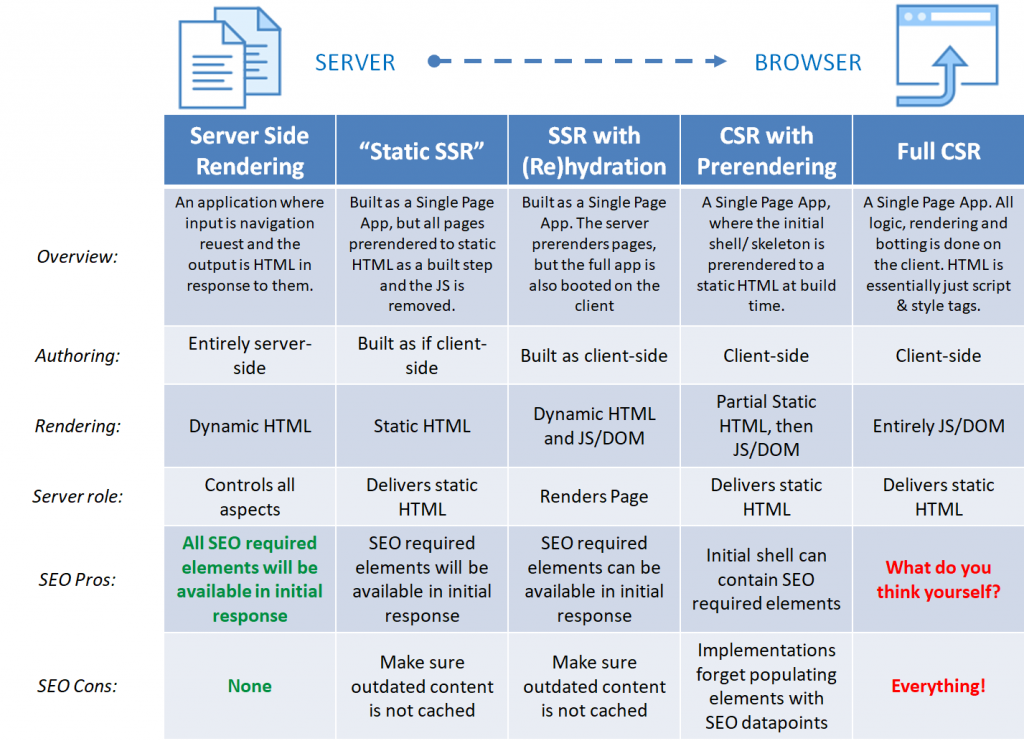
JavaScript and web page rendering types in terms of SEO compatibility.
SSR Hydration means that some of the JS components will be rendered using Client Side Rendering. It is useful for FP and FMP but there can be some downsides for TTI and Speed Index Scores.
Image Source: Notprovided.eu
Coding best practices for JavaScript rendering performance
- Another important compression contribution will come from “_” usage. You may use “underscore.js” for improved JavaScript writing formats and functions. In this way, you will create smaller JS files while manipulating lists and collections with shorter JS Functions without built-in JS functions.
- Using lots of long and exhausting variable changes and global variable pollution are also sources of slow rendering. You should determine the general scope choices of your functions and the global variable/long variable types. Using local variables with ‘Let’ is better for rendering. Because of local variables, browsers won’t audit other global functions-variables for the next change.
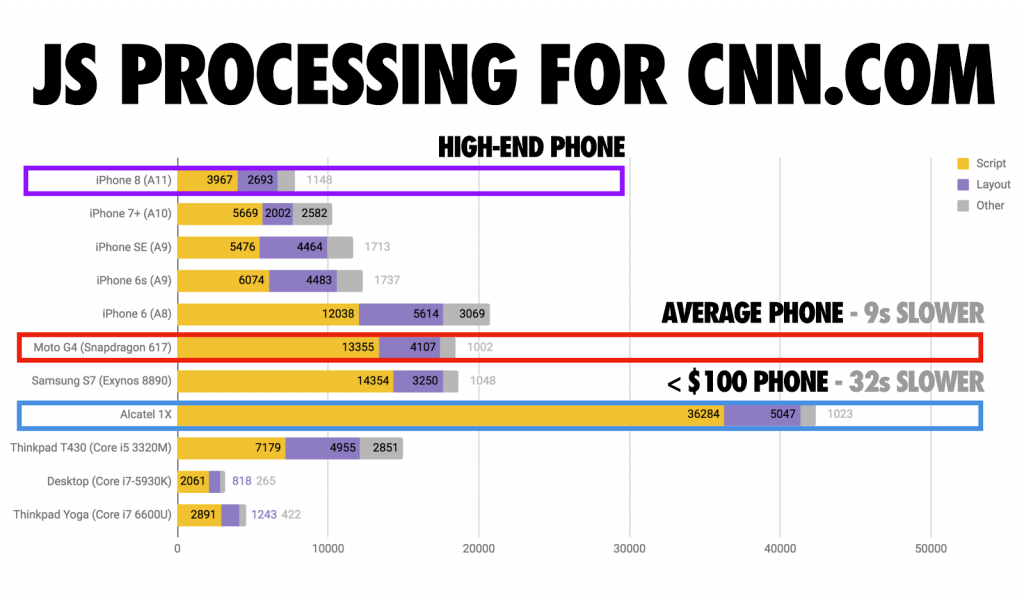
For simulating a more realistic performance examination, for example, what you might see on low-end mobile phones, you should use CPU Throttling and Fast/Slow 3G Connection preferences in Chrome DevTools.
Image Source: Addy Osmani
- Using smaller JS functions and variable chains will help your rendering performance. Additionally, using “this” selector instead of “with” selector is better. “This” selector in Javascript is a local functioning code unlike “with”, same logic with let and var is valid also here.
- If you use your statements in For loop code snippets, this will also slow down your rendering speed by a little bit. Because your function statement will iterate through each element of the loop. You may simply create a new variable for loop elements and you may call these elements with a function which is outside of the For loop.
- If you want to reach an HTML element several times, you can create a variable for it and you can call it with the functions you want. Reaching an HTML element with JavaScript is not a fast process. You might simply create more of a burden for your browser.
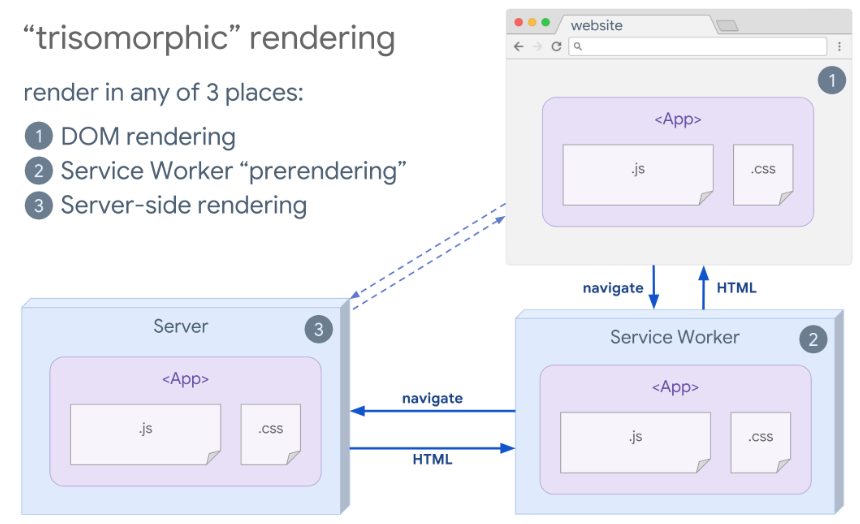
Another way to improve Javascript Rendering Performance is Trisomorphic Rendering via Service Workers. You can put some of your JS files into the client’s browser memory for future sessions. This way, you may make your website work offline.
You can find a simple demo for better understanding and a chance to practice with service workers here
Tying it up: how optimizing JavaScript and page speed affects SEO
To keep JavaScript assets from sabotaging your page speed, we’ve seen how Defer and Async can make a huge difference. We’ve also looked at a few of the “debugging” strategies and coding tips that can help you improve the speed of your pages with JavaScript assets.
Now that we have seen how browsers build web pages, how page speed is measured and affected, and the role that optimizing JavaScript plays in page load time, the next article will demonstrate how resource loading order affects page speed and crawl budget.
If you are interested in reviewing the previous articles in this series of four articles, you can find them here: