
What is SEO forecasting?
SEO forecasting, or organic traffic estimation, is the process of using your own site’s data or third-party data to estimate your site’s future organic traffic, SEO revenue, and SEO ROI. This estimation can be calculated using many different methods based on our data.
In this tutorial, we want to predict our non-branded organic revenue and non-branded organic traffic based on our URLs positions and their current revenue. This can help us as SEOs to get more buy-in from other stakeholders: from increased monthly, quarterly, or yearly budget to more man-hours from the product and dev team.
Keep in mind that this tutorial is not only applicable to non-branded organic traffic; by making a few changes and knowing Python, you can use it to estimate your target pages traffic.
As a result, we can produce a Google Sheet like the image below.
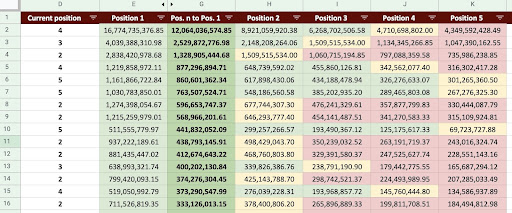
Google Sheets Image
Non-branded SEO traffic forecasting
The first question you may ask after reading the introduction is, “Why calculate non-branded organic traffic?”.
Let’s consider a company like Amazon. When you want to buy a book or a mask, you would simply search, “buy mask amazon.”
Brands are often top of mind and when you want to buy something, your preference is to buy the things you need from these companies. In each industry, there are branded companies that affect users’ behavior in Google searches.
If we were to check Amazon’s Google Search Console (GSC) data, we would likely find that it receives lots of traffic from branded queries, and most of the time, the first result of branded queries is that brand’s site.
As an SEO, like me, you’ve likely heard many times that, “Only our brand helps our SEO!” How can we say, “No, that’s not the case,” and show the traffic and revenue of non-brand queries?
It’s even more complicated to prove this because we know that Google’s algorithms are so complex and it’s difficult to distinctly separate branded from non-branded searches. But this is what makes what we do as SEO’s all the more important.
In this tutorial, I will show you how to distinguish between the two – branded and non-branded – and show you just how powerful SEO can be.
Even if your company is not branded, you can still gain a lot from this article: you can learn how to estimate your site’s organic data.
SEO ROI based on traffic estimation
No matter where you are or what you do, there is a limitation on resources; be it a budget or simply the number of hours in the workday. Knowing how best to allocate your resources plays a major role in overall and SEO return on investment (ROI).
A CMO, a marketing VP, or a performance marketer all have different KPIs and require different resources to meet their objectives. The best way to ensure you get what you need is to prove its necessity by demonstrating the returns it will bring to the company. SEO ROI is no different. When the budget allocation time of year comes around and your team wants to request a larger budget, estimating your SEO ROI can give you the upper hand in negotiating. Once you’ve calculated the non-branded traffic estimation, you can better evaluate the needed budget for achieving the desired results.
The effect of SEO prediction on SEO strategy
As we know, every 3 or 6 months we review our SEO strategy and adjust it to get the best results we can. But what happens when you don’t know where the most profit is for your company? You can make decisions, but they won’t be as effective as decisions made when you have a more comprehensive view of the site’s traffic.
The non-branded organic traffic revenue estimation can be combined with your landing pages and queries segmentation to provide a big picture that will help you develop better strategies as an SEO manager or SEO strategist.
The different ways to forecast organic traffic
There are a lot of different methods and public scripts in the SEO community to predict future organic traffic.
Some of these methods include:
- Organic traffic forecasting on the whole site
- Organic traffic forecasting on the specific pages (blog, products, categories, etc) or a single page
- Organic traffic forecasting on the specific queries (queries contain “buy”, “how-to”, etc.) or a query
- Organic traffic forecasting for specific periods (especially for seasonal events)
My method is for specific pages and the time frame is for one month.
[Case Study] Driving growth in new markets with on-page SEO

How to calculate organic traffic revenue
The accurate way is based on your Google Analytics (GA) data. If your site is brand new, you will have to use 3rd party tools. I prefer to avoid using such tools when you have your own data.
Remember, you’ll need to test the 3rd party data you are using against some of your real page data to find any possible errors in their data.
How to calculate non-branded SEO traffic revenue with Python
So far, we’ve covered a lot of theoretical concepts we should be familiar with in order to better understand the different aspects of our organic traffic and revenue prediction. Now, we’ll dive into the practical part of this article.
First, we’ll start by calculating our CTR curve. In my CTR curve article on Oncrawl, I explain two different methods and also other methods that you can use by making a few changes in my code. I recommend you first read the click curve article; it gives you insights about this article.
In this article, I tweak some parts of my code to get the specific results we want in traffic estimation. Then, we’ll get our data from GA and use the GA revenue dimension to estimate our revenue.
Forecasting the non-brand organic traffic revenue with Python: Getting started
You can run this code by yourself, without knowing any Python. However, I prefer you know a little about Python syntax and basic knowledge about the Python libraries I will use in this forecasting code. This will help you to better understand my code and customize it in a way that is useful for you.
To run this code, I will use Visual Studio Code with the Python extension from Microsoft, which includes the “Jupyter” extension. But, you can use the Jupyter notebook itself.
For the whole process, we need to use these Python libraries:
- Numpy
- Pandas
- Plotly
Also, we will import some Python standard libraries:
- JSON
- pprint
 # Importing the libraries we need for our process
import json
from pprint import pprint

import numpy as np
import pandas as pd
import plotly.express as px
Step 1: Calculating the relative CTR curve (Relative click curve)
In the first step, we want to calculate our relative CTR curve. But, what is the relative CTR curve?
What is the relative CTR curve?
Let’s start first by talking about the ‘absolute CTR curve’. When we calculate the absolute CTR curve, we say the median CTR (or mean CTR) of the first position is 36% and the second position is 20%, and so on.
In the relative CTR curve, instant of percentage, we divide each position median by the first position’s CTR. For example, the first position’s relative CTR curve would be 0.36 / 0.36 = 1, the second would be 0.20 / 0.36 = 0.55, and so on.
Maybe you’re wondering why it’s useful to calculate this? Think about a page ranked at position one, that has 44% CTR. If this page goes to position two, the CTR curve doesn’t decrease to 20%, it’s more likely it’s CTR will decrease to 44% * 0.55 = 24.2%.
1. Getting branded and non-branded organic traffic data from GSC
For our calculation process, we need to get our data from GSC. The first time, all data will be based on branded queries and the next time, all data will be based on non-branded queries.
To get this data, you can use different methods: from Python scripts or from the “Search Analytics for Sheets” Google Sheets add-on. I will use the GSC API explorer.
The output of this data is two JSON files that show each page’s performance. One JSON file that shows landing pages performance based on branded queries and the other shows landing pages performance based on the non-branded queries.
To obtain data from GSC API explorer, follow these steps:
- Go to the https://developers.google.com/webmaster-tools/v1/searchanalytics/query.
- Maximize the API explorer that is in the top right corner of the page.
- In the “
siteUrl” field, insert your domain name. For example “https://www.example.com” or “http://your-domain.com”. - In the request body, first we need to define “
startDate” and “endDate” parameters. My preference is the past 30 days. - Then we add “
dimensions” and select “page” for this list. - Now we add “
dimensionFilterGroups” to filter our queries. Once for the branded ones and a second for non-branded queries. - At the end, we set our “
rowLimit” to 25,000. If your site pages that get organic traffic each month is more than 25K, you must modify your request body. - After making each request, save the JSON response. For branded performance, save the JSON file as “
branded_data.json” and for non-branded performance, save the JSON file as “non_branded_data.json”.
After we understand the parameters in our request body, the only thing you need to do is copy, and paste below request bodies. Consider replacing your brand names with “brand variation names”.
You must separate brand names with a pipeline or “|”. For example “ amazon|amazon.com|amazn”.
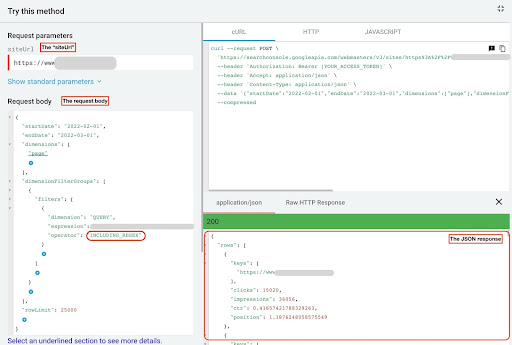
GSC API Explorer
Branded request body:
{
  "startDate": "2022-02-01",
  "endDate": "2022-03-01",
  "dimensions": [
    "page"
  ],
  "dimensionFilterGroups": [
    {
      "filters": [
        {
          "dimension": "QUERY",
          "expression": "brand variation names",
          "operator": "INCLUDING_REGEX"
        }
      ]
    }
  ],
  "rowLimit": 25000
}
Non-branded request body:
{
  "startDate": "2022-02-01",
  "endDate": "2022-03-01",
  "dimensions": [
    "page"
  ],
  "dimensionFilterGroups": [
    {
      "filters": [
        {
          "dimension": "QUERY",
          "expression": "brand variation names",
          "operator": "EXCLUDING_REGEX"
        }
      ]
    }
  ],
  "rowLimit": 25000
}
2. Importing the data into our Jupyter notebook and extracting site directories
Now, we need to load our data into our Jupyter notebook to be able to modify it and extract what we want from it. Let’s pick up where we left off above.
In order to load branded data, you need to execute this block of code:
# Creating a DataFrame for the website URLs performance on the brand, and branded queries
with open("./branded_data.json") as json_file:
    branded_data = json.loads(json_file.read())["rows"]
    branded_df = pd.DataFrame(branded_data)

# Renaming 'keys' column to 'landing page' column, and converting 'landing page' list to an URL
branded_df.rename(columns={"keys": "landing page"}, inplace=True)
branded_df["landing page"] = branded_df["landing page"].apply(lambda x: x[0])
For landing pages non-branded performance, you’ll need to execute this block of code:
# Creating a DataFrame for the website URLs performance on the non-branded queries
with open("./non_branded_data.json") as json_file:
    non_branded_data = json.loads(json_file.read())["rows"]
    non_branded_df = pd.DataFrame(non_branded_data)

# Renaming 'keys' column to 'landing page' column, and converting 'landing page' list to an URL
non_branded_df.rename(columns={"keys": "landing page"}, inplace=True)
non_branded_df["landing page"] = non_branded_df["landing page"].apply(lambda x: x[0])
We load our data, then we need to define our site name to extract its directories.
# Defining your site name between quotes. For example, 'https://www.example.com/' or 'http://mydomain.com/'
SITE_NAME = "https://www.your_domain.com/"
We only need to extract the directories from the non-branded performance.
# Getting each landing page (URL) directory
non_branded_df["directory"] = non_branded_df["landing page"].str.extract(
    pat=f"((?<={SITE_NAME})[^/]+)"
)
Then we print out the directories in order to select which ones are important for this process. You may want to select all directories to get better insight into your site.
# For getting all directories in the output, we need to manipulate Pandas options
pd.set_option("display.max_rows", None)

# Website directories
non_branded_df["directory"].value_counts()
Here, you can insert whichever directories are important to you.
""" Choose which directories are important for getting their CTR curve.
Insert the directories into the 'important_directories' variable.
For example, 'product,tag,product-category,mag'. Separate directory values with comma.
"""

IMPORTANT_DIRECTORIES = "your_important_directories"
IMPORTANT_DIRECTORIES = IMPORTANT_DIRECTORIES.split(",")
3. Labeling the pages based on their position and calculating the relative CTR curve
Now we need to label our landing pages based on their position. We do this, because we need to calculate the relative CTR curve for each directory based on its landing page’s position.
# Labeling non-branded positions
for i in range(1, 11):
    non_branded_df.loc[
        (non_branded_df["position"] >= i) & (non_branded_df["position"] < i + 1),
        "position label",
    ] = i
Then, we group landing pages based on their directory.
# Grouping landing pages based on their 'directory' value
non_brand_grouped_df = non_branded_df.groupby(["directory"])
Let’s define the function to calculate relative CTR curve.
def each_dir_relative_ctr_curve(dir_df, key):
    """The function calculates each IMPORTANT_DIRECTORIES relative CTR curve.
    """
    # Grouping "non_brand_grouped_df" based on their 'position label' value
    dir_grouped_df = dir_df.groupby(["position label"])

    # A list for saving each position median CTR
    median_ctr_list = []
    # Storing each directory as a key, and it's "median_ctr_list" as value
    directories_median_ctr = {}

    # Loop over each "dir_grouped_df" group
    for i in range(1, 11):
        # A try-except for handling those situations that a directory for example hasn't any data for position 4
        try:
            tmp_df = dir_grouped_df.get_group(i)
            median_ctr_list.append(np.median(tmp_df["ctr"]))
        except:
            median_ctr_list.append(0)

    # Calculating relative CTR curve
    directories_median_ctr[key] = np.array(median_ctr_list) / np.array(
        [median_ctr_list[0]] * 10
    )

    return directories_median_ctr
After we define the function, we run it.
# Looping over directories and executing the 'each_dir_relative_ctr_curve' function
directories_median_ctr_dict = dict()

for key, item in non_brand_grouped_df:
    if key in IMPORTANT_DIRECTORIES:
        directories_median_ctr_dict.update(each_dir_relative_ctr_curve(item, key))

pprint(directories_median_ctr_dict)
Now, we’ll load our landing pages, branded and non-branded, performance and calculate the relative CTR curve for our non-brand data. Why do we do this for non-brand data only? Because we want to predict the non-brand organic traffic and revenue.
Step 2: Predicting the non-branded organic traffic revenue
In this second step, we’ll get into how to retrieve our revenue data and predict our revenue.
1. Merging branded and non-branded organic data
Now, we’ll merge our branded and non-branded data. This will help us calculate the percentage of non-branded organic traffic on each landing page as compared to all traffic.
# 'main_df' is a combination of 'whole site data' and 'non-brand data' DataFrames.
# Using this DataFrame, you can find out where most of our clicks and impressions
# come from Queries that aren't branded.

main_df = non_branded_df.merge(
    branded_df, on="landing page", suffixes=("_non_brand", "_branded")
)
Then we modify the columns to remove useless ones.
# Modifying 'main_df' columns to those we need
main_df = main_df[
    [
        "landing page",
        "clicks_non_brand",
        "ctr_non_brand",
        "directory",
        "position label",
        "clicks_branded",
    ]
]
Now, let’s calculate the non-branded clicks percentage to a landing page’s total clicks.
# Calculating the non-branded queries clicks percentage based on landing pages to the whole landing page clicks
main_df.loc[:, "clicks_non_brand_percentage"] = main_df.apply(
    lambda x: x["clicks_non_brand"] / (x["clicks_non_brand"] + x["clicks_branded"]),
    axis=1,
)
[Ebook] Automating SEO with Oncrawl

2. Loading the organic traffic revenue
Just like retrieving the GSC data, we have a number of ways to get the GA data: we could use the “Google Analytics Sheets add-on” or the GA API. In this tutorial, I prefer to use Google Data Studio (GDS) because of its simplicity.
In order to obtain the GA data from GDS, follow these steps:
- In GDS, create a new report or explorer and a table.
- For the dimension add “landing page” and for the metric, we must add “Revenue”.
- Then, you’ll need to create a custom segment in GA based on source and medium. Filter the “Google/organic” traffic. After segment creation, add it to the segment section in GDS.
- At the final step, export the table and save it as “
landing_pages_revenue.csv”.
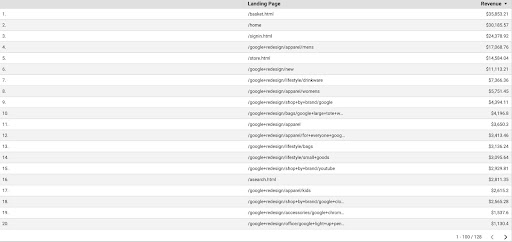
Landing pages revenue csv export
Let’s load our data.
organic_revenue_df = pd.read_csv("./data/landing_pages_revenue.csv")
Now, we need to append our site name to the GA landing pages’ URLs.
When we export our data from GA, the landing pages are in a relative form, but our GSC data is in the absolute form.
Don’t forget to check your GA landing pages data. In the data sets I worked with, I found that the GA data needs a little cleanup each time.
 # Concating GA landing pages URLs with the SITE_NAME.
# Also, renaming the columns
organic_revenue_df.loc[:, "Landing Page"] = (
    SITE_NAME[:-1] + organic_revenue_df[organic_revenue_df.columns[0]]
)
organic_revenue_df.rename(columns={"Landing Page": "landing page", "Revenue": "revenue"}, inplace=True)
Now, let’s merge our GSC data with GA data.
 # In this step, I merge 'main_df' with 'dk_organic_revenue_df' DataFrame that contains the percentage of non-brand queries data
main_df = main_df.merge(organic_revenue_df, on="landing page", how="left")
At the end of this section, we do a little cleanup on our DataFrame columns.
 # A little cleaning up the 'main_df' DataFrame
main_df = main_df[
    [
        "landing page",
        "clicks_non_brand",
        "ctr_non_brand",
        "directory",
        "position label",
        "clicks_non_brand_percentage",
        "revenue",
    ]
]
3. Calculating the non-branded revenue
In this section, we’ll process data to extract the information we are looking for.
But before anything, let’s filter our landing pages based on “IMPORTANT_DIRECTORIES”:
 # Removing other directories landing pages, not included in "IMPORTANT_DIRECTORIES"
main_df = (
    main_df[main_df["directory"].isin(IMPORTANT_DIRECTORIES)]
    .dropna(subset=["revenue"])
    .reset_index(drop=True)
)
Now, let’s calculate the non-branded organic revenue traffic.
I defined a metric that we can’t calculate easily and it’s more intuition than anything else that leads us to assign a number to it.
The “ brand_influence” metric shows the strength of your brand. If you believe non_brand searches drive fewer sales to your business, make this number lower; something like 0.8 for example.
 # If your brand is so strong that querying without your brand can sell as much as querying with your brand, then 1 is good for you.
# Think about looking for a book without a brand name included in your query. When you see Amazon, do you buy from other marketplaces or stores?
brand_influence = 1
main_df.loc[:, "non_brand_revenue"] = main_df.apply(
    lambda x: x["revenue"] * x["clicks_non_brand_percentage"] * brand_influence, axis=1
)
Let’s plot a pie chart to get some insight into the non-branded revenue based on the important directories.
 # In this cell I want to get all of non-brand landing pages revenue based on their directory
non_branded_directory_dist_revenue_df = pd.pivot_table(
    main_df,
    index="directory",
    values=["non_brand_revenue"],
    aggfunc={"non_brand_revenue": "sum"},
)

pie_fig = px.pie(
    non_branded_directory_dist_revenue_df,
    values="non_brand_revenue",
    names=non_branded_directory_dist_revenue_df.index,
    title="Non-branded revenue based on website directories",
)
pie_fig.update_traces(textposition="inside", textinfo="percent+label")

pie_fig.show()
This plot shows the non-branded queries distribution on your IMPORTANT_DIRECTORIES.

Non-branded queries distribution
Based on my CTR curve data, I see that I can’t rely on the CTR for positions higher than 5. Because of this, I filter my data based on position.
You can modify the below code block based on your data.
 # Because of CTR accuracy in our CTR curve, I think we can skip landings with position more than 5. Because of this, I filtered other landing pages
main_df = main_df[main_df["position label"] < 6].reset_index(drop=True)
4. Calculating “Revenue per click” (RPC)
Here, I created a custom metric and called it “Revenue per Click” or RPC. This shows us the revenue each non-branded click generated.
You can use this metric in different ways. I found a page with high RPC, but low clicks. When I checked the page, I found out it was indexed less than one week ago and we can use different methods to optimize the page.
 # Calculating the revenue generated with each click (RPC: Revenue Per Click)
main_df["rpc"] = main_df.apply(
    lambda x: x["non_brand_revenue"] / x["clicks_non_brand"], axis=1
)
5. Predicting the revenue!
We are getting to the end, we waited until now to predict our non-branded organic revenue.
Let’s run the last code blocks.
 # The main function to calculate revenue based on different positions
for index, row_values in main_df.iterrows():
    # Switch between directories CTR list
    ctr_curve = directories_median_ctr_dict[row_values["directory"]]

    # Loop over position 1 to 5 and calculate the revenue based on increase or decrease of CTR
    for i in range(1, 6):
        if i == row_values["position label"]:
            main_df.loc[index, i] = row_values["non_brand_revenue"]
        else:
            # main_df.loc[index, i + 1] ==
            main_df.loc[index, i] = (
                row_values["non_brand_revenue"]
                * (ctr_curve[i - 1])
                / ctr_curve[int(row_values["position label"] - 1)]
            )

    # Calculating the "N to 1" metric. This shows the increase in revenue when your rank get from "N" to "1"
    main_df.loc[index, "N to 1"] = main_df.loc[index, 1] - main_df.loc[index, row_values["position label"]]
Looking at the final output, we have new columns. The names of these columns are “1”, “2”, “3”, “4”, “5”.
What do these names mean? For example, we have a page in position 3 and we want to predict its revenue if it improves its position, or we want to know how much we’ll lose if we drop in rank.
The columns “1” and “2” show the revenue of the page when the average position of this page improves and columns “4” and “5” show the revenue of this page when we drop in the ranking.
Column “3” in this example shows the page’s current revenue.
Also, I created a metric called “N to 1”. This shows you if this page’s average position moves from “3” (or N) to “1” and how much the move can affect the revenue.
Wrapping up
I covered a lot in this article and now it’s your turn to get your hands dirty and predict your non-branded organic traffic revenue.
This is the simplest way we can use this prediction. We could make this algorithm more complex and combine it with some ML models, but that would make the article more complicated.
I prefer to save this data in a CSV and upload it to a Google Sheet. Or, if I plan on sharing it with the other members of my team or the organization, I’ll open it with excel and format the columns using colors so it’s easier to read.
Based on this data, you can predict your non-branded organic traffic ROI and use it in your negotiation process.